Choosing strikes and expirations
Every covered call is two choices: which strike, and which expiration. Neither has a right answer. Each trades one thing you want against another, and this lesson shows the trade-offs side by side.
The strike: premium against the cap
A covered call with its strike close to the current price pays more premium than one further above it, and it’s more likely to finish in the money, so your shares are more likely to be called away. A call far above the price pays little, and leaves more room for the shares to rise.
The option chain’s Greeks view gives a quick way to compare strikes. A call’s delta is a rough stand-in for the chance it finishes in the money: a call with a delta of 0.30 is, very roughly, a 30% chance your shares are called away at expiration.
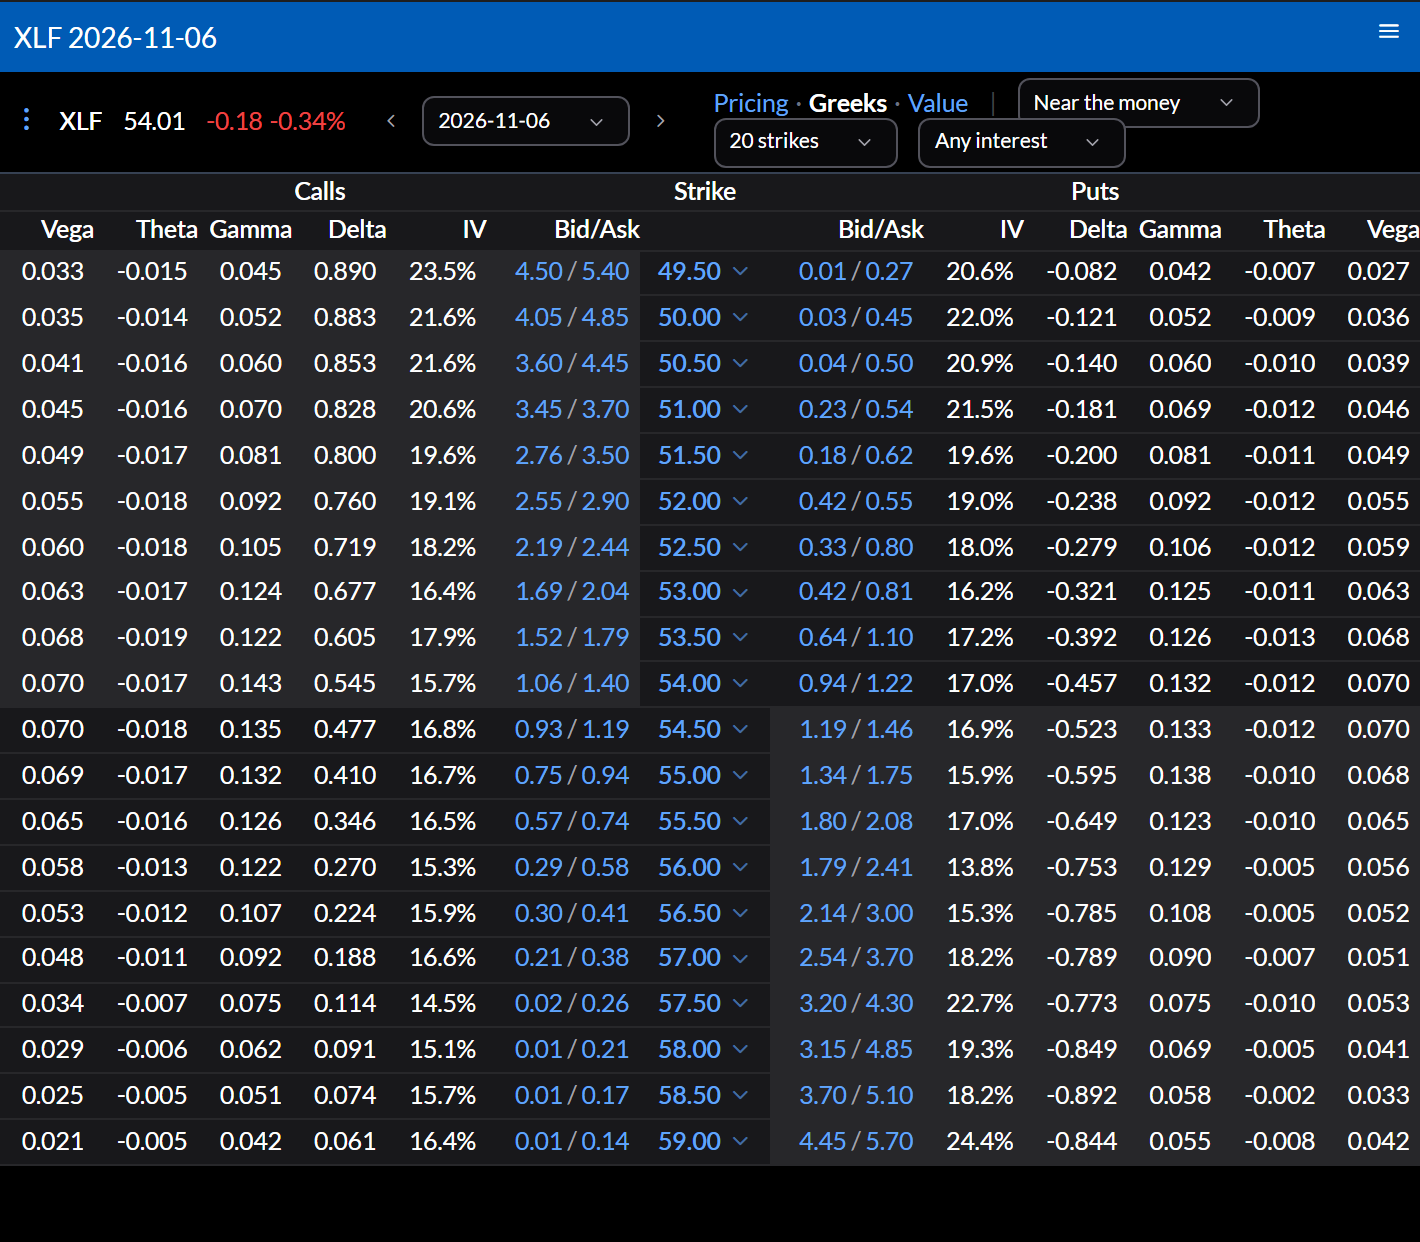
Delta isn’t exactly that probability, and Qwidgets works out the chance of profit a different way. How Qwidgets estimates the chance of profit explains both. For choosing among strikes, the rough reading is enough.
Here are three covered calls in the same expiration, at deltas near 0.15, 0.30, and 0.45:
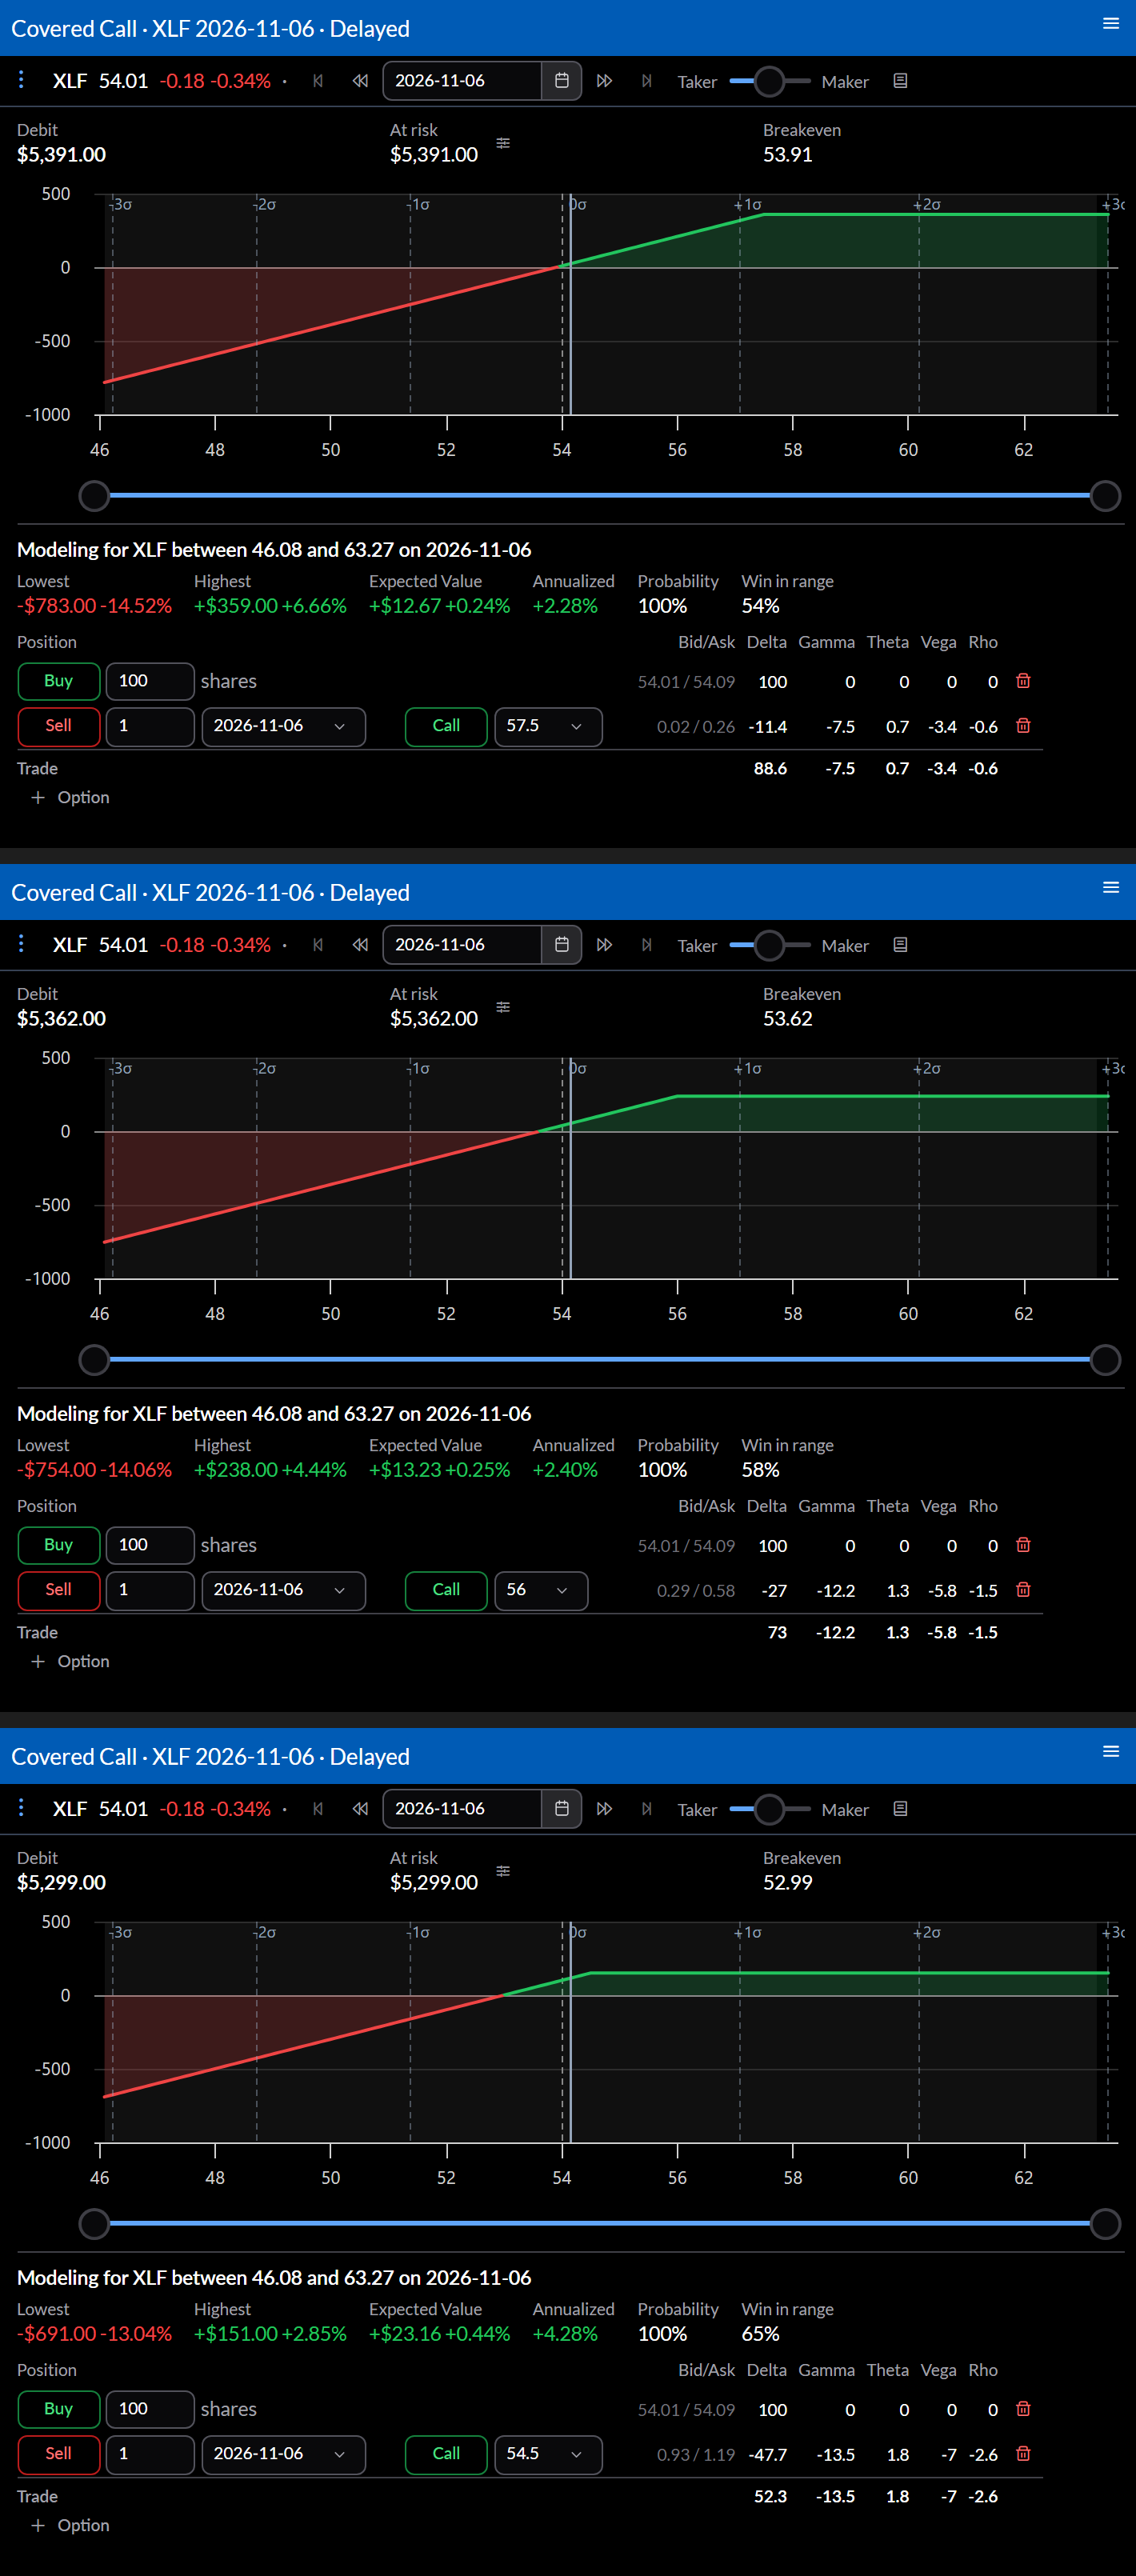
Read down the three:
- Debit falls as the strike gets closer to the price, because the call pays more.
- Highest, the most the position can make, falls too: the cap comes sooner.
- Win in range, with the forecast set wide, rises as the strike gets closer, because the premium lowers the breakeven. You’re trading upside for a higher chance of a small gain.
- Expected Value weighs the two. Read it with care.
The premium comes from market prices, and the chances come from a model that uses one volatility for every strike. The market doesn’t: it usually prices strikes away from the current price at different implied volatilities than those near it, a pattern called the skew. Where the model and the market disagree, Expected Value shows the disagreement, not a free edge. How Qwidgets estimates the chance of profit explains why.
The same trade-off applies to cash-secured puts, mirrored: a put closer to the price pays more and is more likely to be assigned.
What you’re really choosing is a pattern of outcomes. A strike further out wins less often and leaves you more of the upside. A strike closer in wins more often, wins less, and gives up the upside sooner. Choose the pattern you’d rather live with, on shares you’d be comfortable holding either way.
The expiration: premium per day against flexibility
An option’s premium doesn’t grow in step with its time to expiration. Under the usual pricing models it grows closer to the square root of the time, so a 30-day option is worth noticeably more than half of a 60-day one at the same delta. Selling shorter expirations collects more premium for each day you hold the position.
What you give up:
- Faster moves in your position. A short-dated option’s value reacts more sharply to the share price as expiration approaches, so a move late in its life shows up quickly.
- More decisions. Each expiration is another choice of strike, another fill across the bid-ask spread, and another chance to get it wrong.
- What’s on the calendar. The longer the expiration, the more likely it spans an earnings report, an ex-dividend date, or a scheduled economic announcement. Check the calendar before you sell covers that.
Many traders who sell covered calls choose expirations a few weeks to a couple of months out, which keeps a reasonable premium without a decision every few days. Whatever you choose, compare the same delta across expirations rather than the same strike, so you’re comparing like with like.
Open the live version: the chain and all three covered calls on today’s delayed prices. Switch the chain to a later expiration and see how the premium at the same delta changes.
What’s next
- Screen for covered calls and cash-secured puts: search the whole market for calls in the delta and expiration range you want.
- Option chain: the Pricing, Greeks, and Value views.