Follow a Wheel in the Campaign Journal
A Wheel isn’t one trade. It’s a put, maybe an assignment, shares, a call or several, and finally the shares called away. Judged trade by trade, it can look like a string of small wins and one large loss, or the other way around. The Campaign Journal puts the whole thing on one timeline, so you can see what the Wheel actually made. In this tutorial you’ll find a Wheel in your account’s campaigns, read its timeline and how each leg did, and filter to all your Wheels at once.
You’ll need a connected brokerage account with a Wheel in its history; see Connect a brokerage. The screenshots follow a Wheel on one fund: a cash-secured put that was assigned, then a covered call that was called away.
1. Open Performance
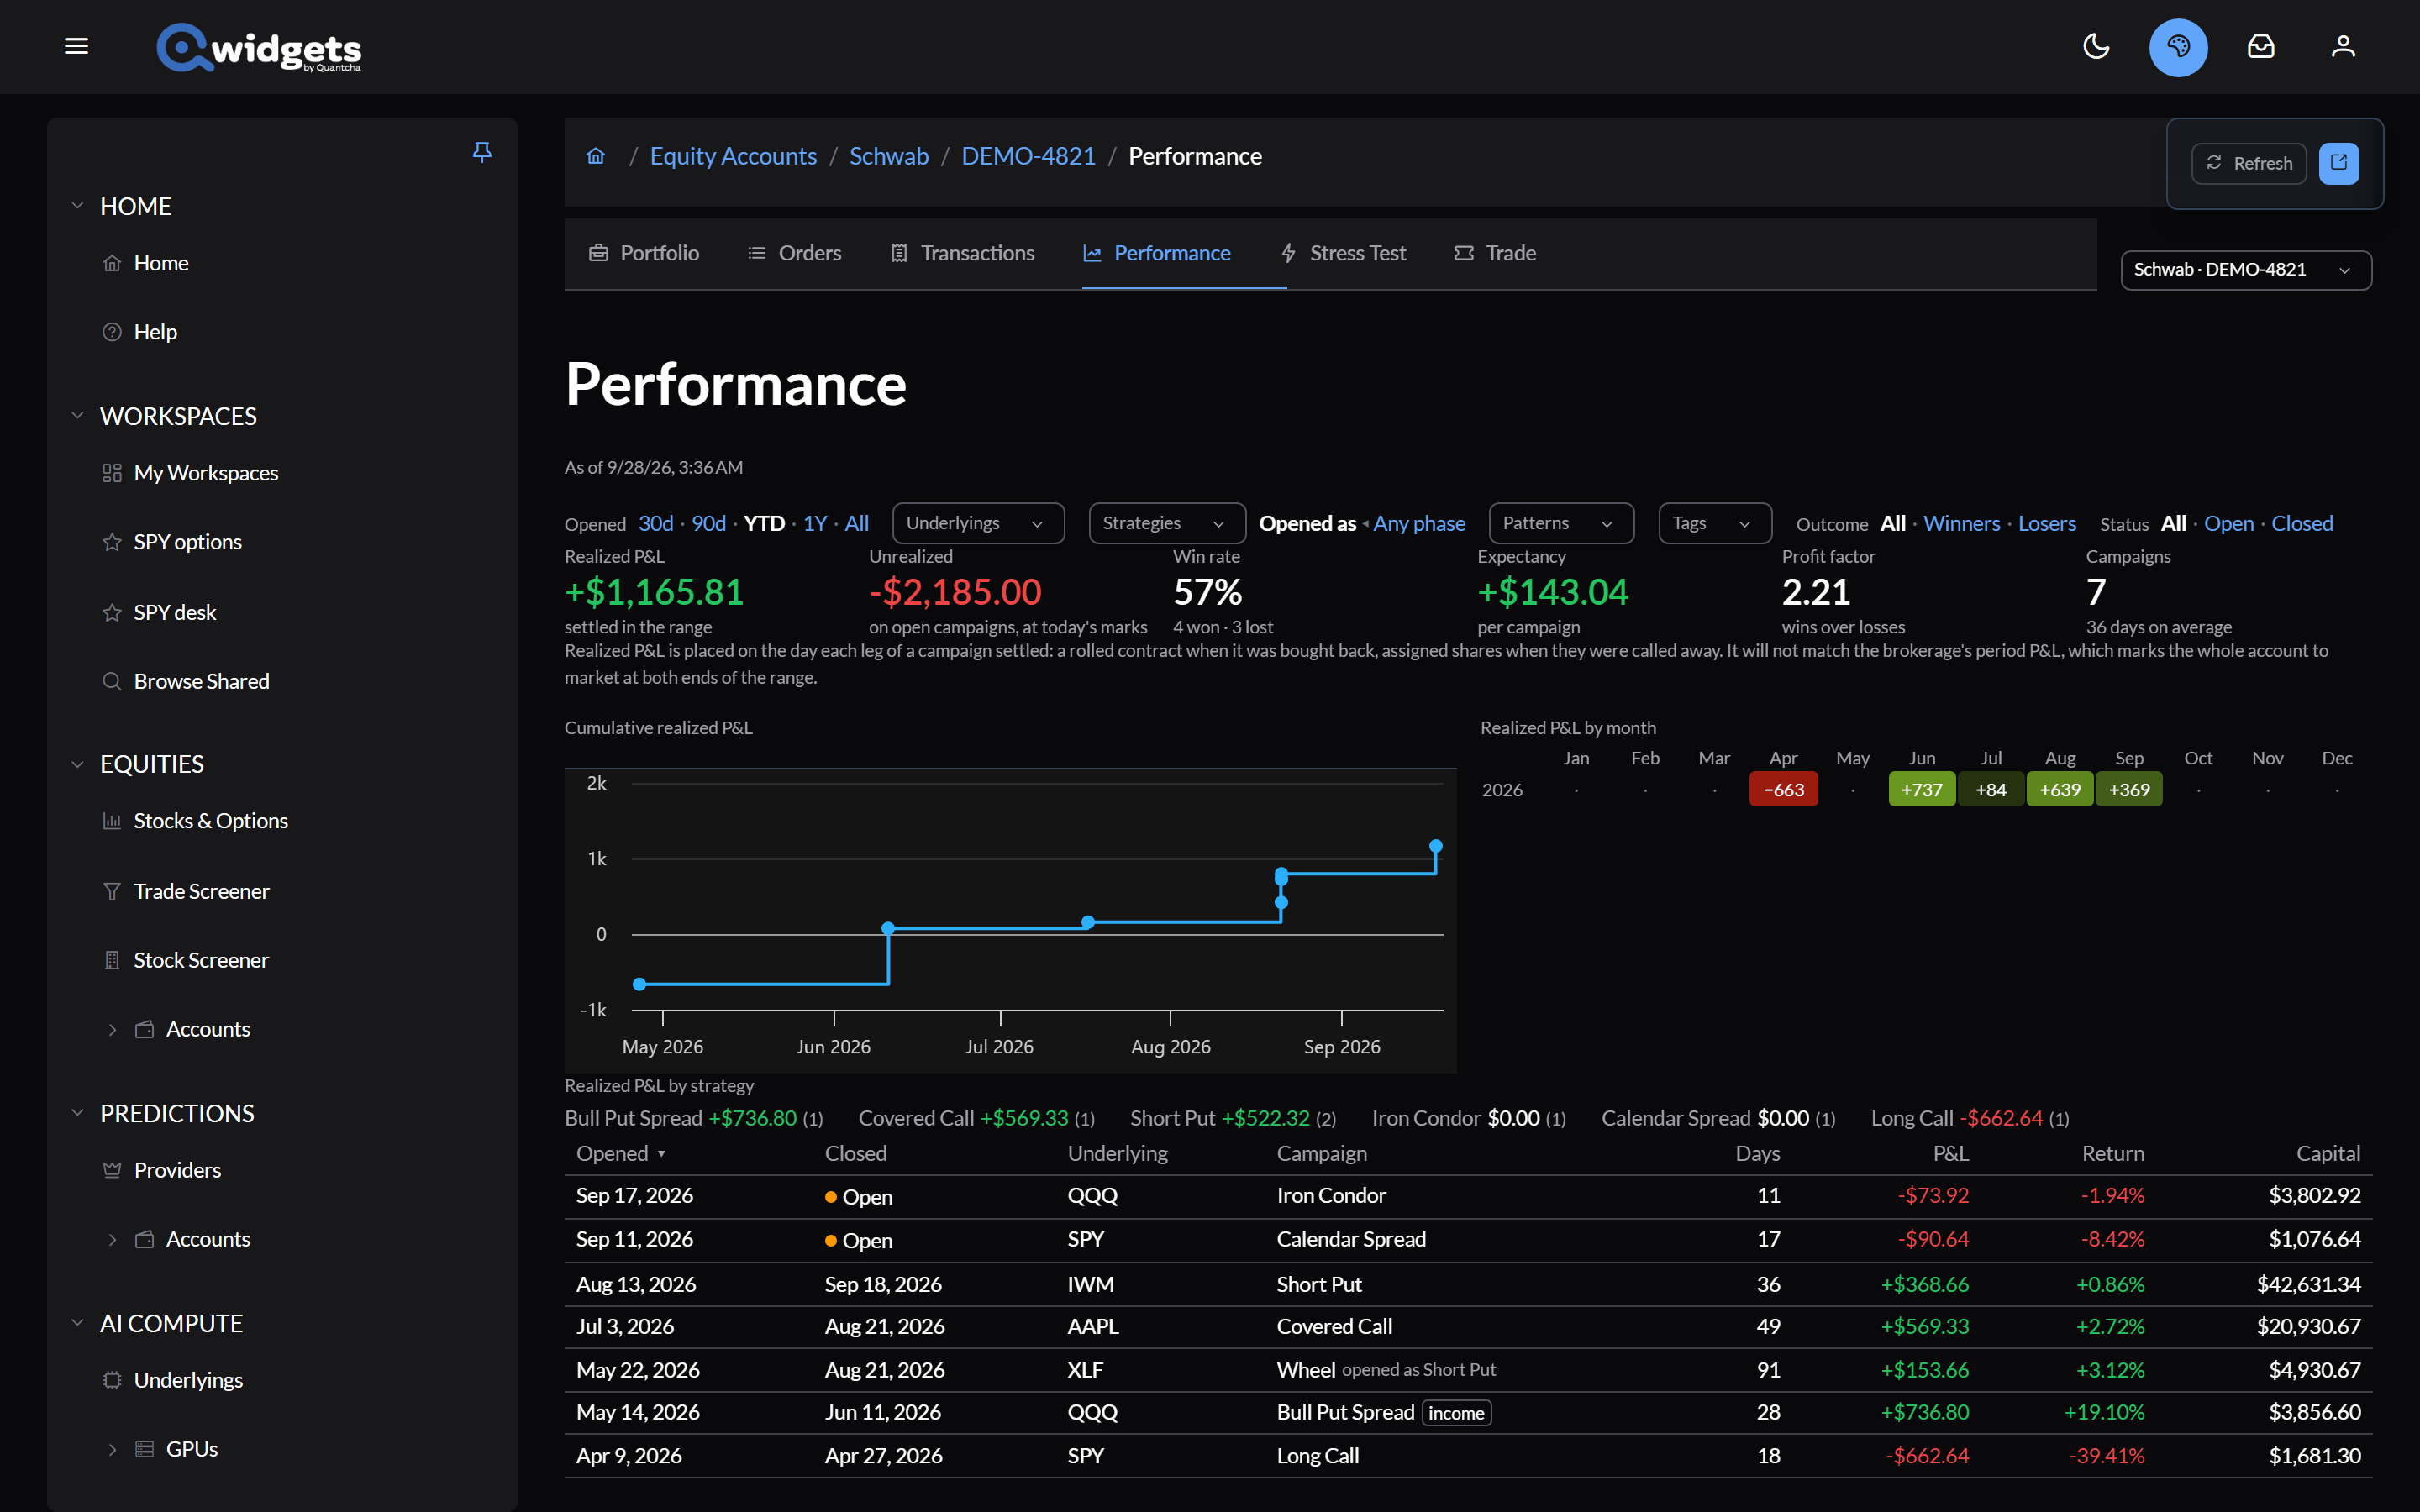
Open your brokerage account and select Performance. If it asks first, select Load all transactions. The campaign list is below the summary figures and charts.
2. Find the Wheel
In the filters above the list, set Status to Closed. If the Wheel started before this year, set Opened to All too.
Qwidgets recognizes a Wheel on its own: a campaign that starts with a short put, is assigned, and goes on to a covered call is titled Wheel in the list. A campaign runs from flat to flat in one underlying, so the whole Wheel, from the first put to the shares being called away, is one campaign.

3. Read the timeline
Select the campaign. Its timeline opens beneath it.
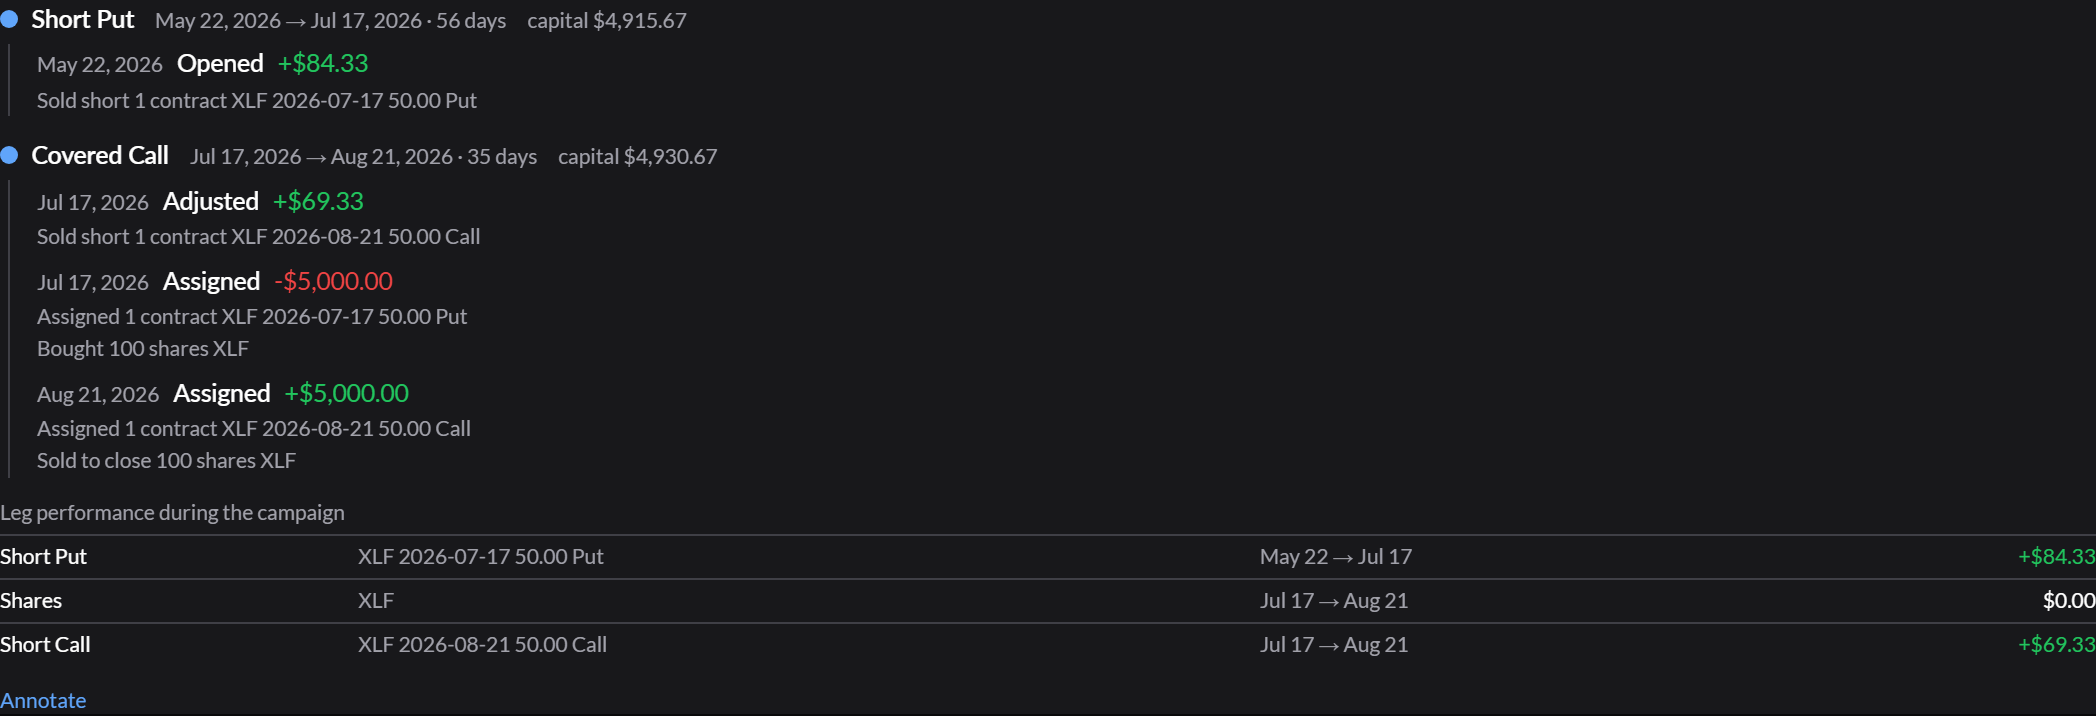
The timeline is split into phases, each headed by the strategy the campaign held: first Short Put, then Covered Call. Within them, each action shows the cash it moved:
- Opened is the put you sold.
- The second phase starts on the day the put was assigned. It lists Assigned, where the put was exercised and you bought 100 shares at the strike, and Adjusted, the call you sold on those shares. Actions on the same day aren’t necessarily listed in the order they happened.
- Assigned again at the end: the call was exercised and your shares were called away. That leaves you flat, so the campaign ends there.
Assignment appears in the middle of the campaign, not at its end, which is how the Wheel works.
4. Read how each leg did
Scroll to Leg performance during the campaign.

Compare the premiums from the put and the call with the result on the shares. In a Wheel that went well, the shares roughly broke even and the premiums are the profit. In one that went badly, the shares’ loss dwarfs the premiums. Either way, the campaign’s total is what the Wheel made.
5. Note what you learned, and review your Wheels together
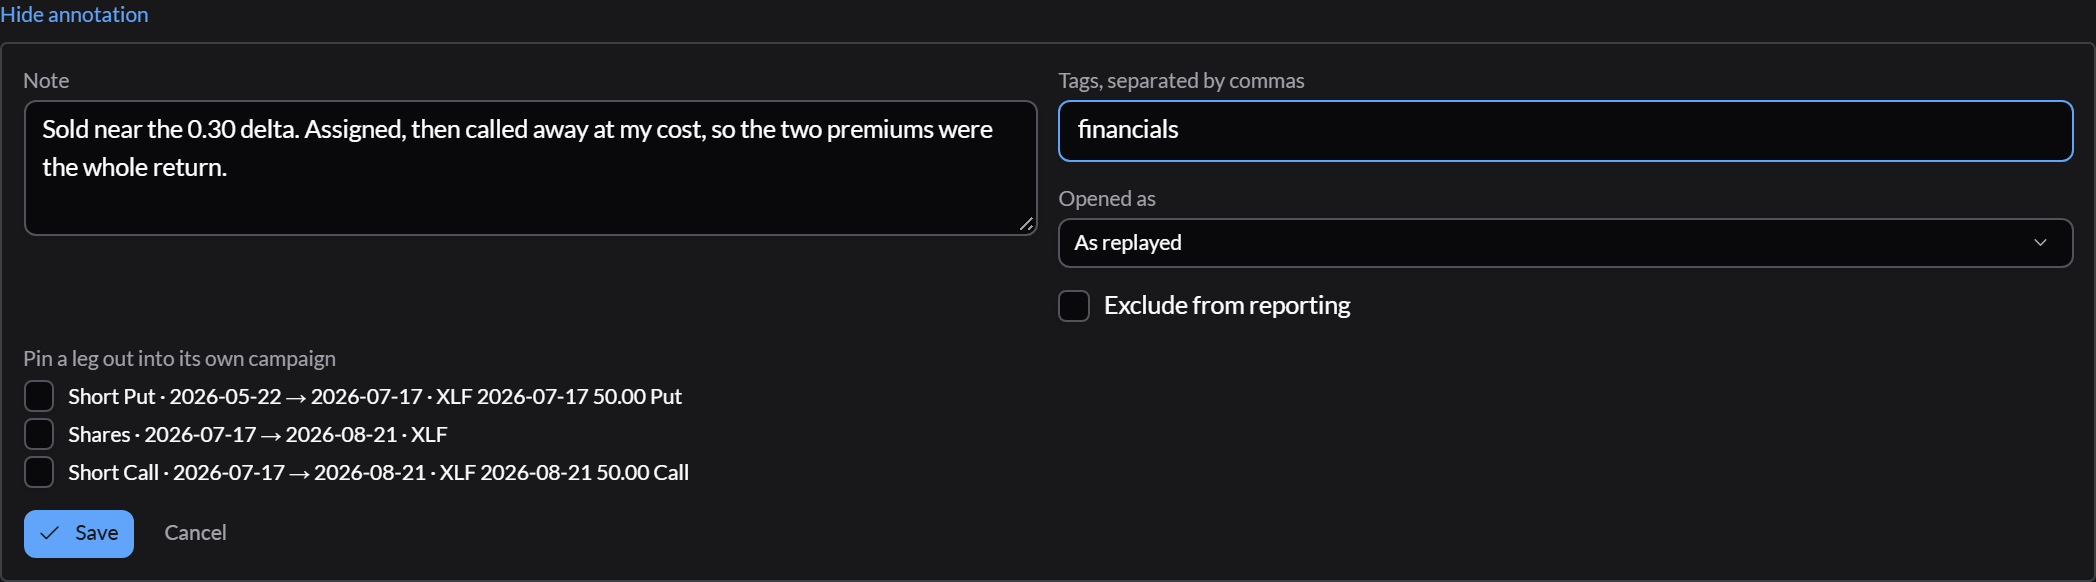
Select Annotate and write a Note on why you opened it and what you’d do differently. Tags, separated by commas lets you group campaigns your own way, for example by why you chose the stock. Then select Save.
To see every Wheel together, set the Patterns filter above the list to Wheel. The win rate, expectancy, and charts at the top of the page then cover only your Wheels.
What’s next
- Campaign Journal: everything on the timeline, and correcting a cost basis or merging campaigns.
- Performance: win rate, expectancy, and the equity curve.
- When the Wheel breaks: what a campaign that went badly usually looks like, and why.