Analyze a cash-secured put
A cash-secured put is the first phase of the Wheel, and the trade most Wheel decisions come down to: which strike, which expiration, and whether the premium is worth the risk. In this tutorial you’ll build one in Trade analysis, set the forecast wide enough to read its chance of profit, and see what moving the strike changes.
You don’t need an account; everything here works as a guest, on delayed data. The screenshots follow a put on XLF, the Financial Select Sector SPDR Fund, about five weeks from expiration. It’s an illustration, not a recommendation.
1. Open Trade analysis
Select Stocks & Options in the left-hand menu, search for the symbol, and open its page. Then select the Analyze tab. It opens with 100 shares and a forecast one standard deviation either side of the current price, so there’s already a chart to replace.
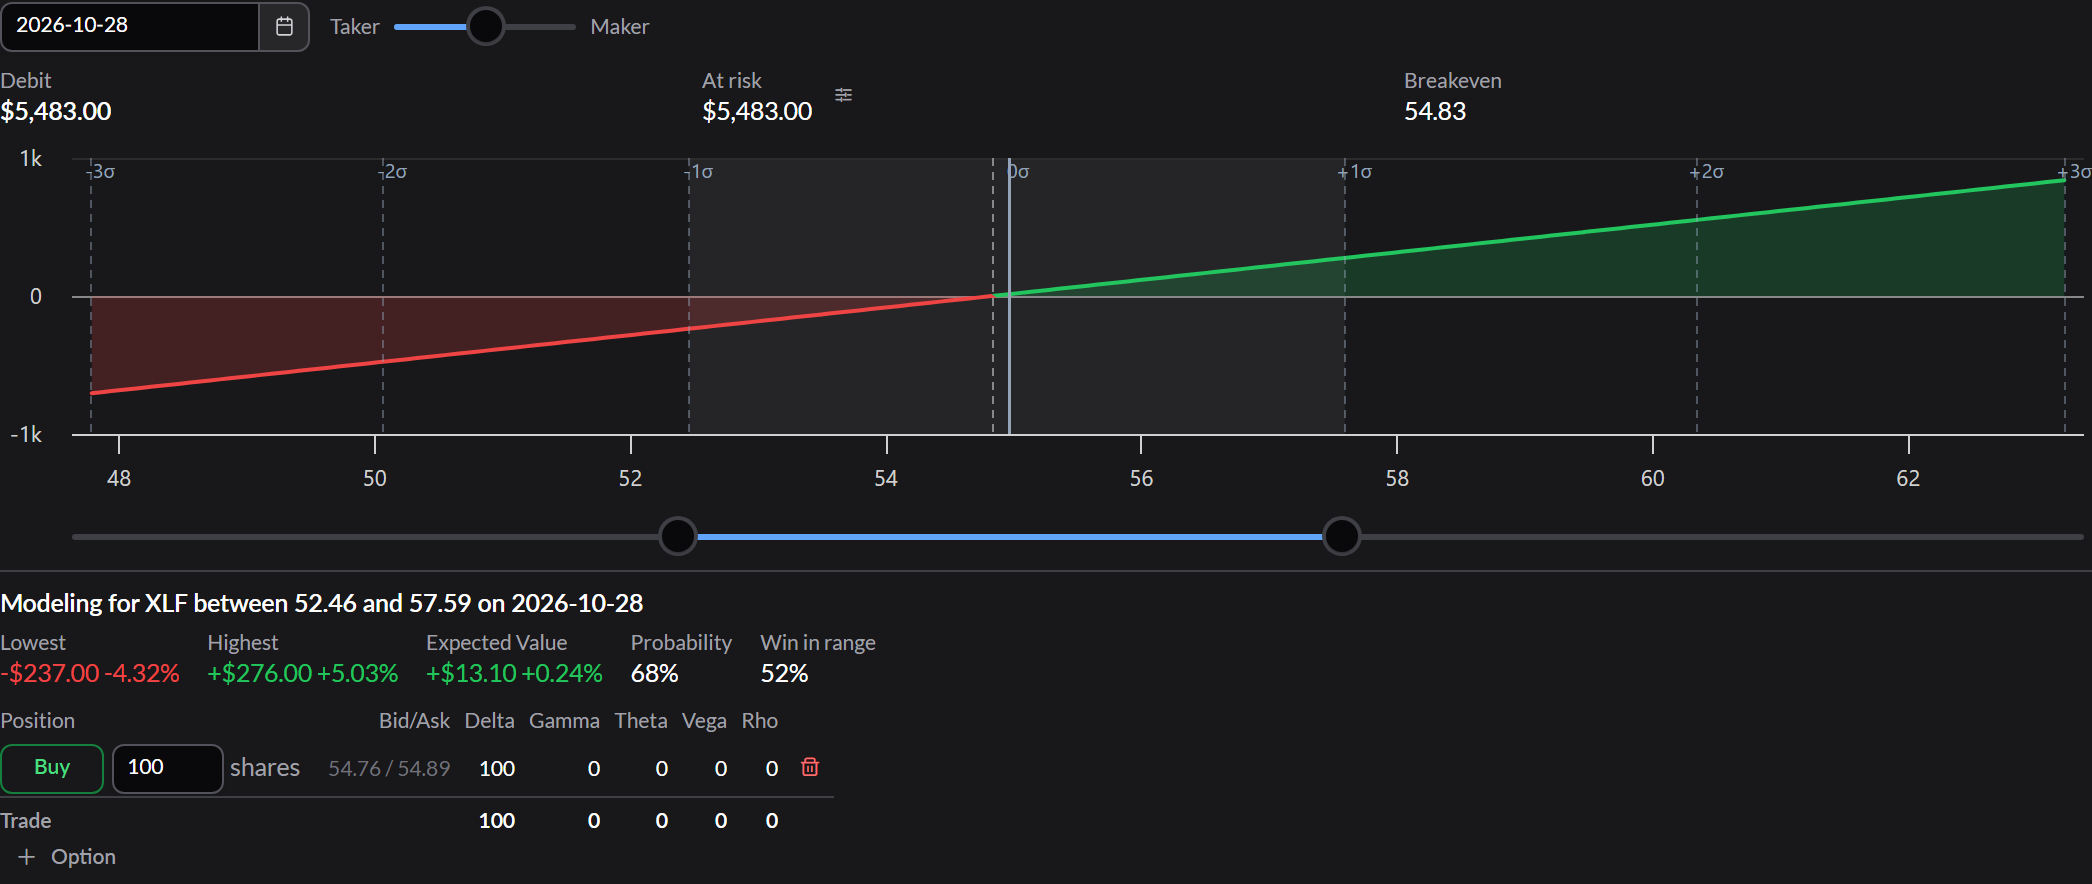
2. Replace the shares with a put
- Select the trash icon at the end of the shares row to remove them.
- Select + Option below the legs table.
- On the new row, select Buy to switch it to Sell, and Call to switch it to Put. The quantity is already 1.
- Pick an Expiration about 30 to 45 days out, then a Strike below the current price.
- Read the row’s Delta. It shows the position’s delta, per 100 shares, so a short put whose contract delta is −0.30 reads about 30. Try strikes until it’s near 30.
- Set the date above the chart to the put’s expiration; expiration dates are marked in the calendar. Until you do, the chart values the trade 30 days out, which may be before the put expires.
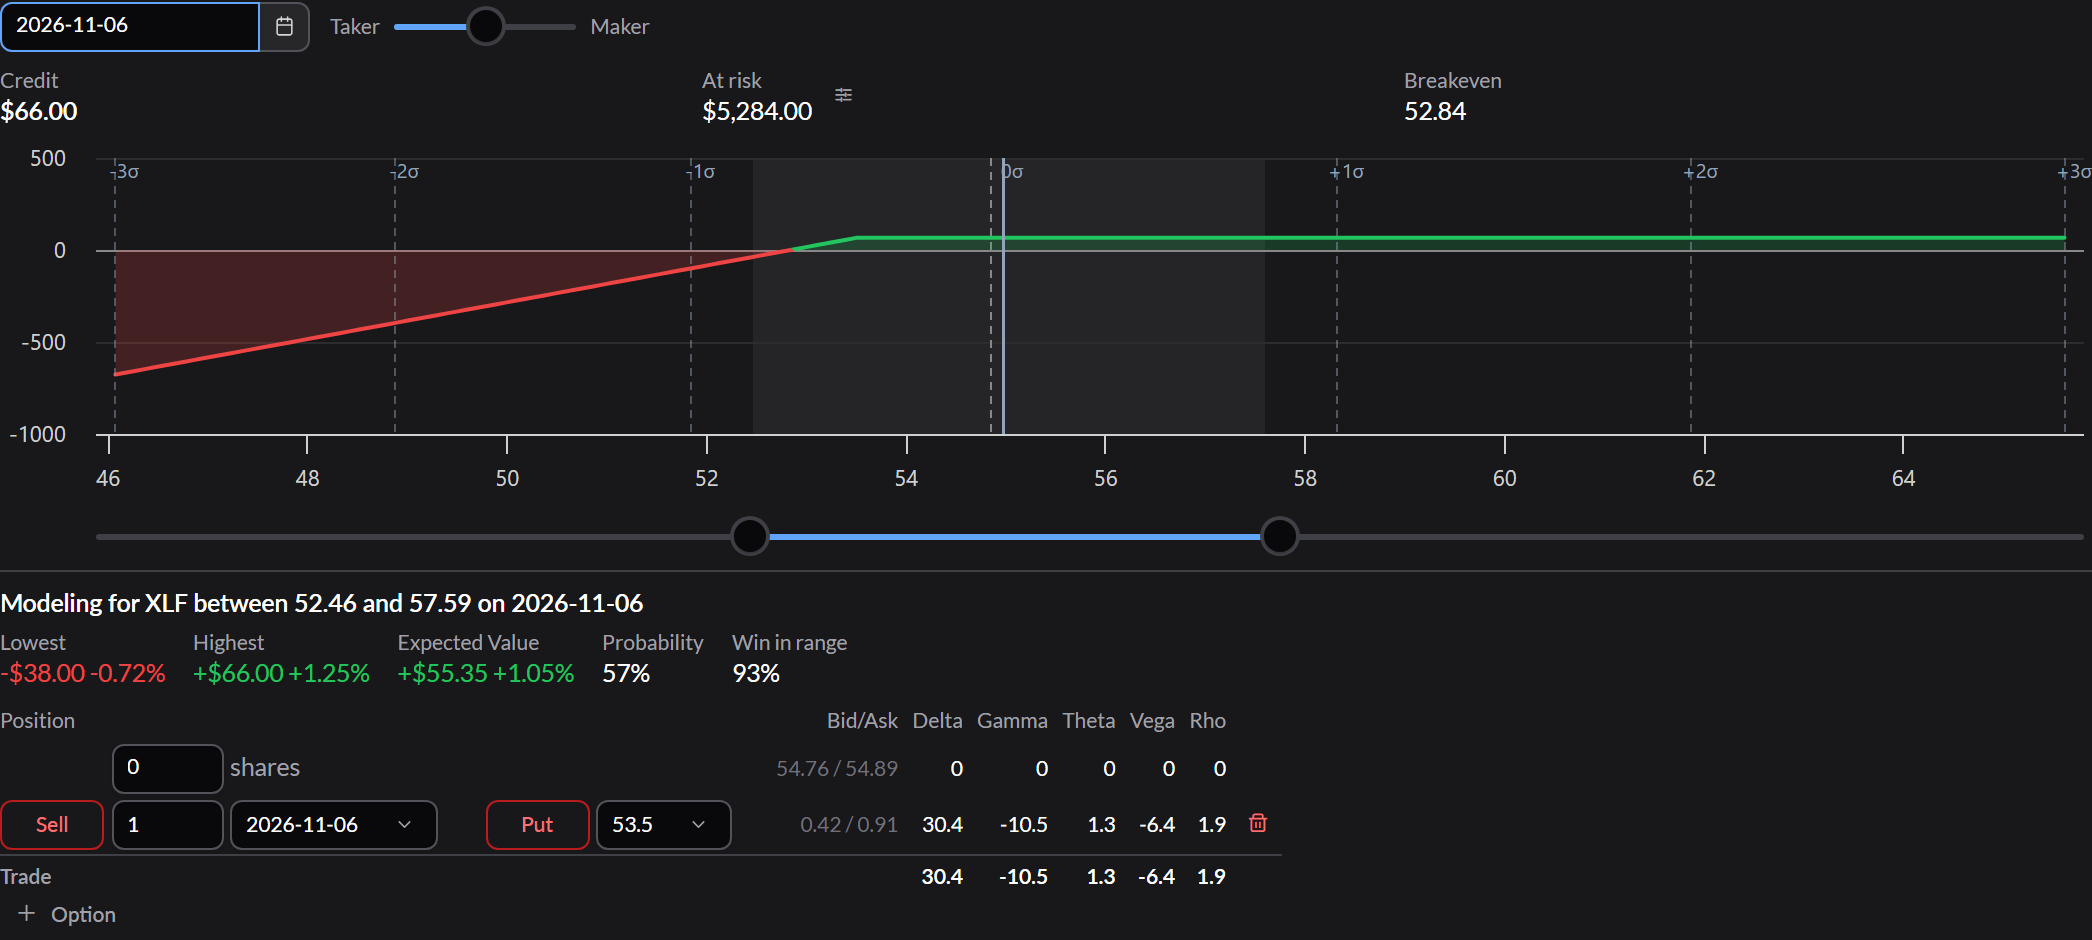
The chart takes the shape of every short put at expiration: flat to the right of the strike, where you keep the premium, and falling to the left, where you’d be assigned on shares worth less than the strike.
3. Widen the forecast
Drag both ends of the forecast range under the chart out to the ends of its track. The track spans three standard deviations either side of the price, so Probability, under Modeling for…, reaches nearly 100%.
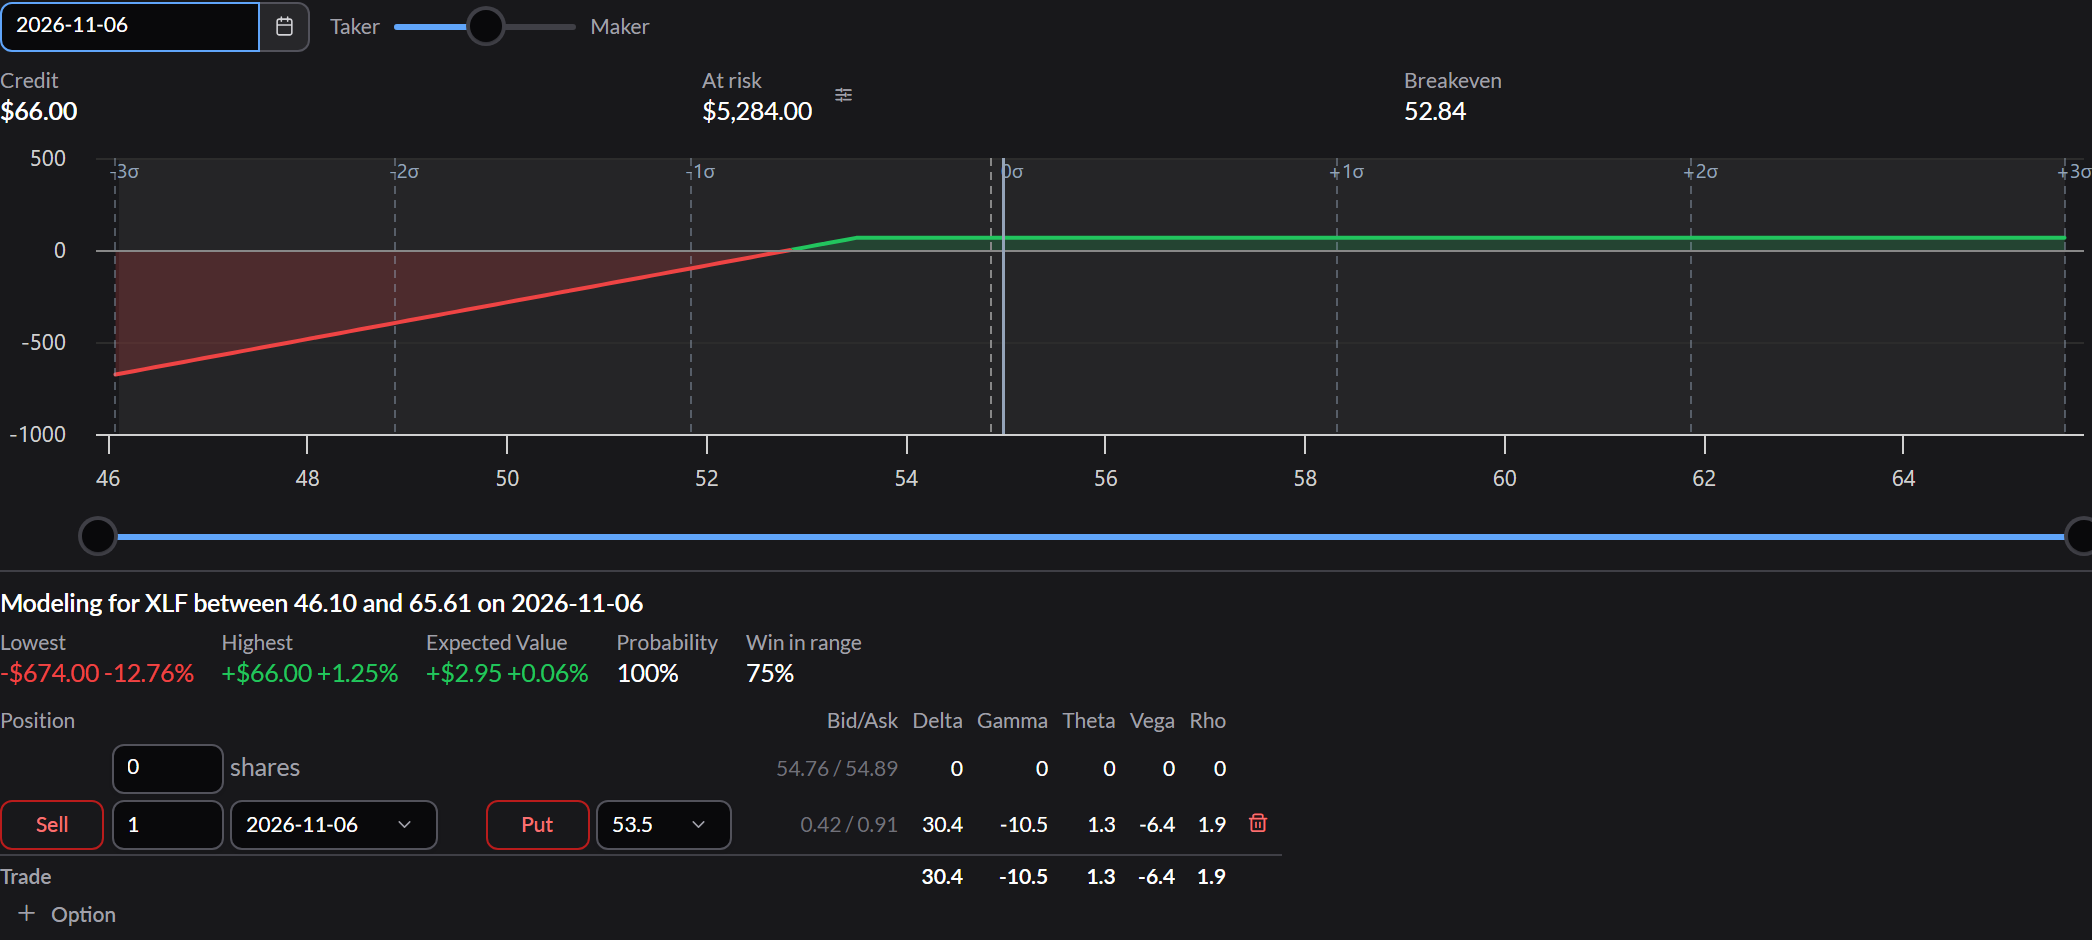
With the range covering nearly every outcome, Win in range is, in effect, the chance the trade makes money at all. How Qwidgets estimates the chance of profit explains why, and what the model assumes.
4. Read the trade
Read the figures above the chart and under Modeling for…:
- Credit is the premium you collect.
- At risk is the most the trade can lose: the strike times 100, less the credit, if the shares went to zero. It’s close to the cash you’d set aside to secure the put.
- Breakeven is where the payoff crosses zero on the date you set. At expiration, that’s the strike less the premium per share. Below it, the trade loses.
- Win in range is the chance of profit, with the range this wide.
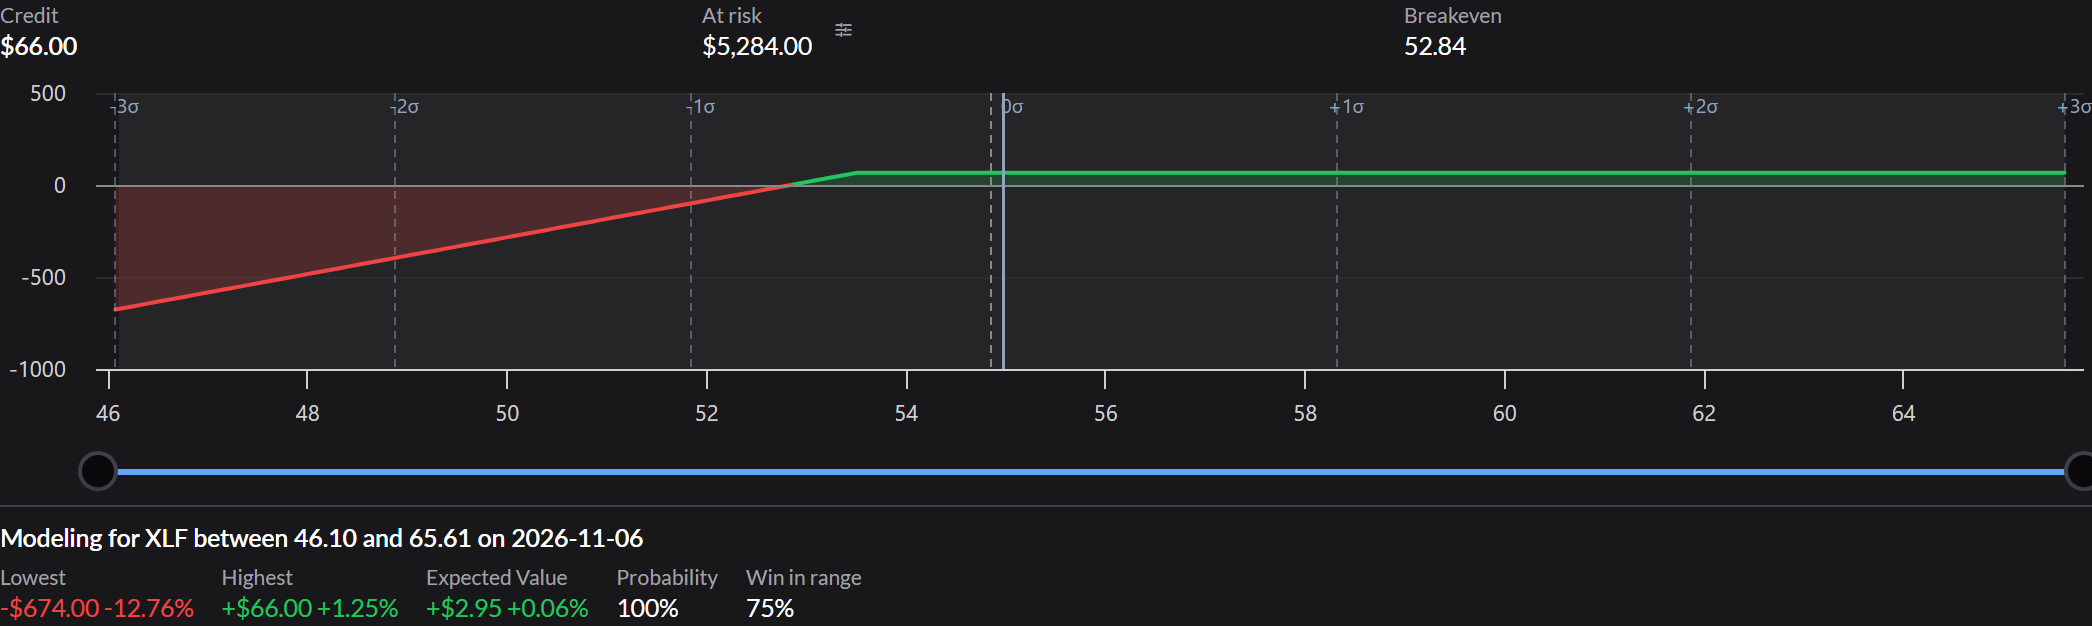
Compare the credit with the amount at risk. That ratio, and how often you’d keep it, is the whole trade.
5. Try a closer strike
Pick the next Strike up, closer to the current price.
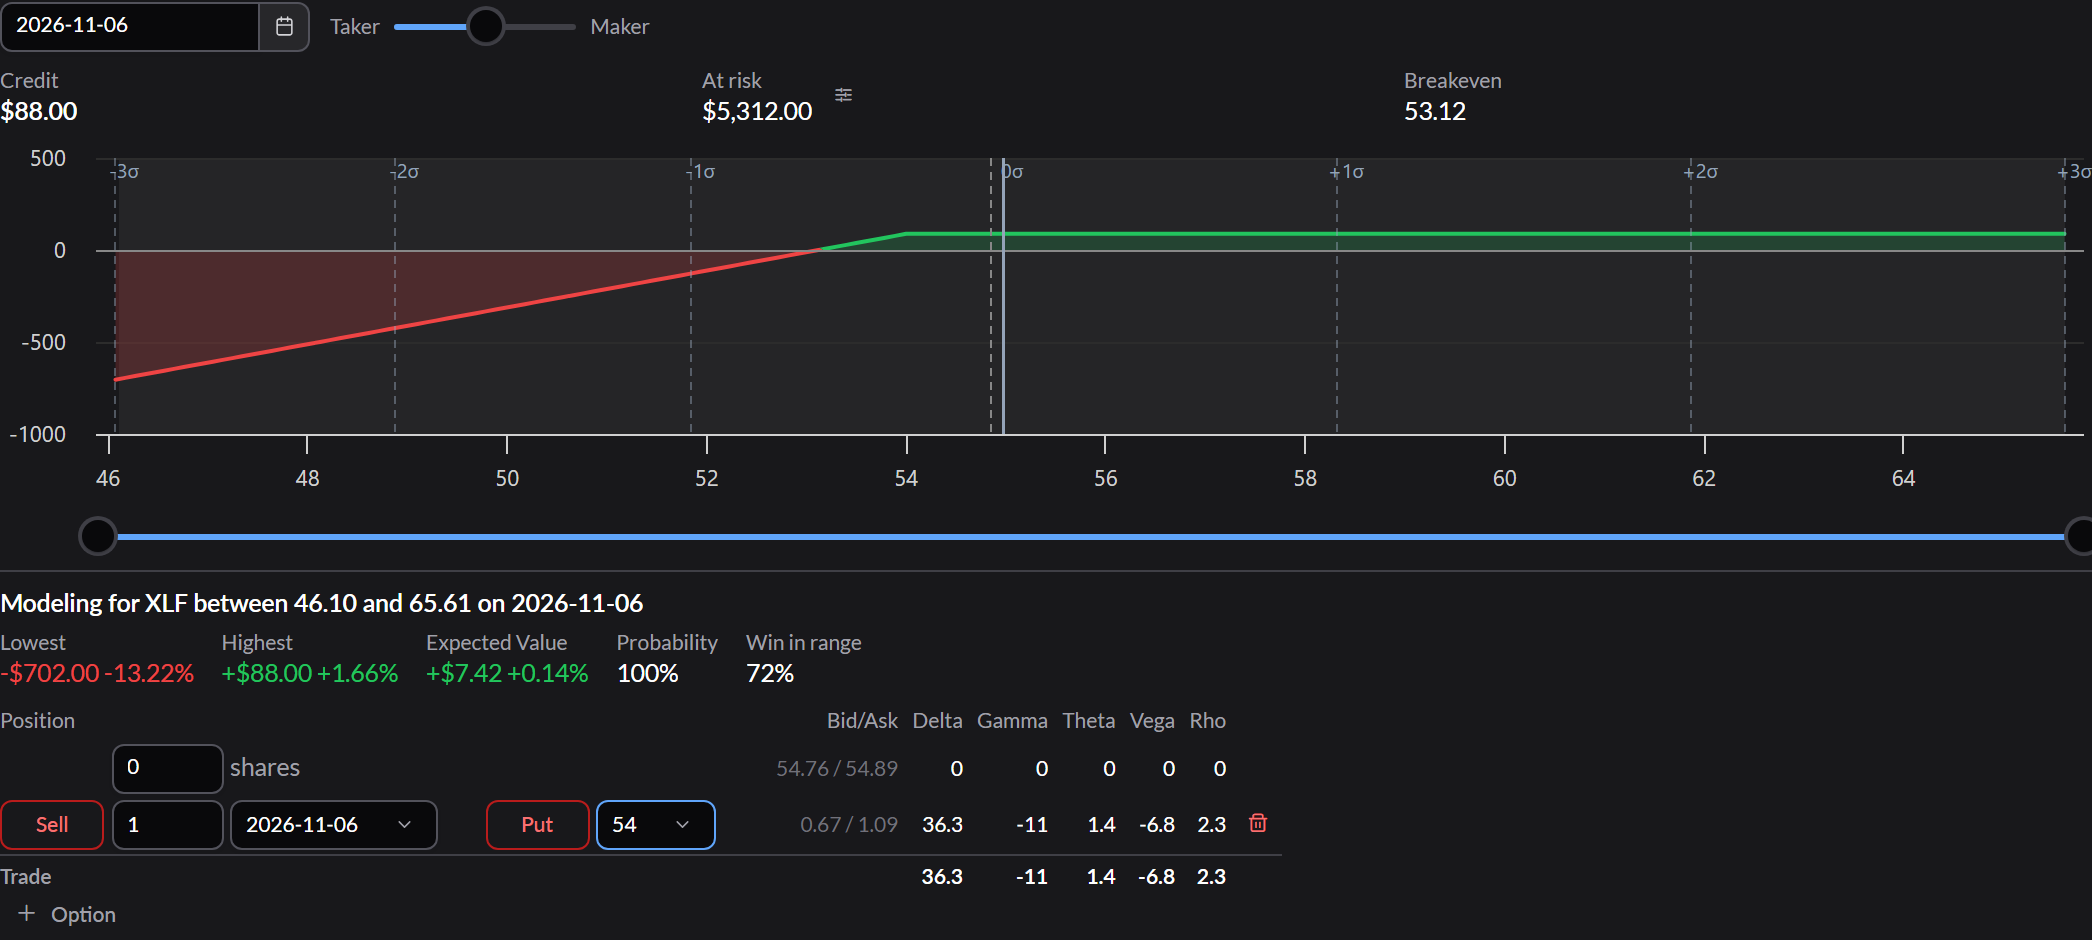
The credit rises, the breakeven rises with it, and Win in range falls. You’re paid more because you’re more likely to be assigned. Choosing strikes and expirations looks at that trade-off in more depth.
What’s next
- The Wheel: the learning path this tutorial belongs to.
- Trade analysis: every setting on the page.
- How Qwidgets estimates the chance of profit: the model behind Win in range.
- Disclosures & Model Limits: these are models, not forecasts, and not investment advice.