Option chain
The Chain tab on a symbol’s page shows every call and put for one expiration, strike by strike. Pick the expiration at the top, or step through them with the arrows.
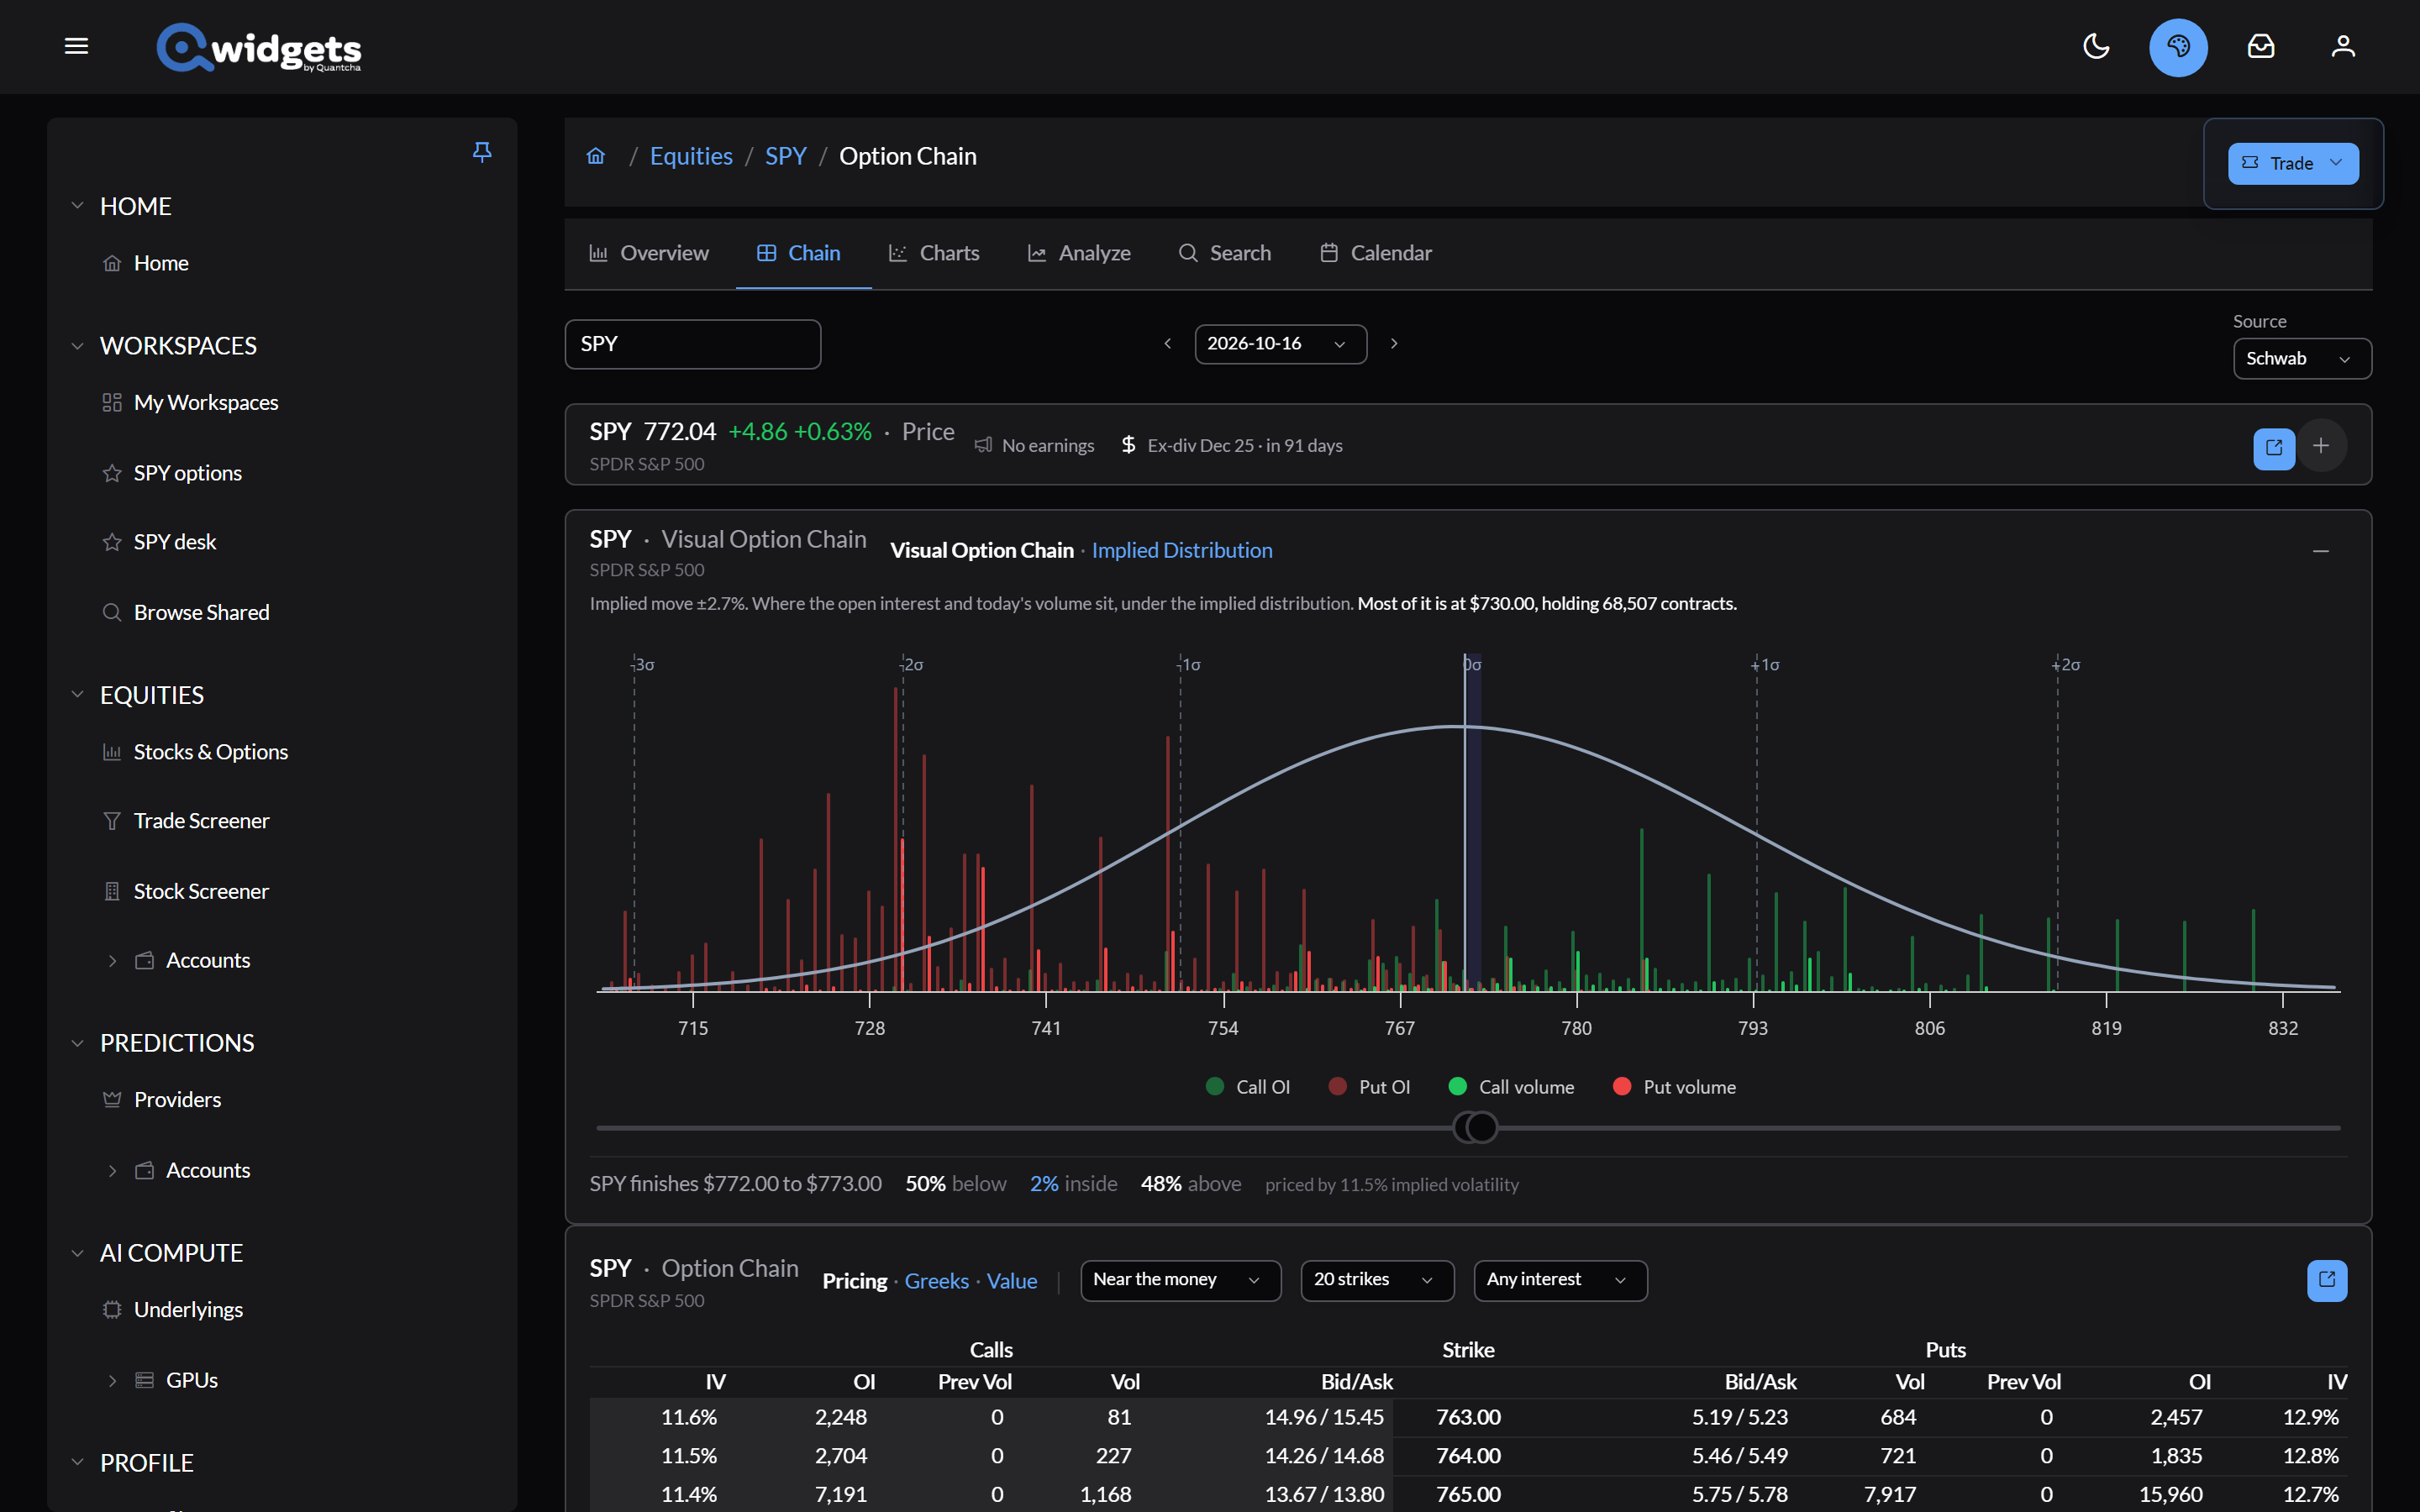
Visual Option Chain
The chart above the table shows where the market’s positions are:
- Visual Option Chain plots open interest and today’s volume by strike, for calls and puts, under the distribution the chain implies. The caption says where most of it sits.
- Implied Distribution compares the probability the chain prices into each band of prices with what a single implied volatility would say, and notes where the two disagree most.
The slider under the chart picks a price range, and the line below it reads out how likely the market says it is that the underlying finishes below, inside, and above that range at expiration.
The table
Calls are on the left, puts on the right, and strikes down the middle. The at-the-money row is highlighted, and in-the-money cells are shaded.
- Pricing, Greeks, and Value switch the columns: bid/ask, volume, open interest, and implied volatility; the Greeks; or intrinsic value, time value, and the spread.
- Near the money, Below the money, Above the money, or All strikes choose which strikes to show, and 20 strikes through Every strike how many.
- Any interest through 1,000+ held hides strikes with little open interest.
Prices with a wide bid/ask spread are grayed out, because they’re unlikely to trade at those prices.
To analyze a trade from here, go to the Analyze tab. To put the chain on a workspace, use Share To Workspace. The Option Chain widget also lets you open trades from its prices and strikes.