Option Chart
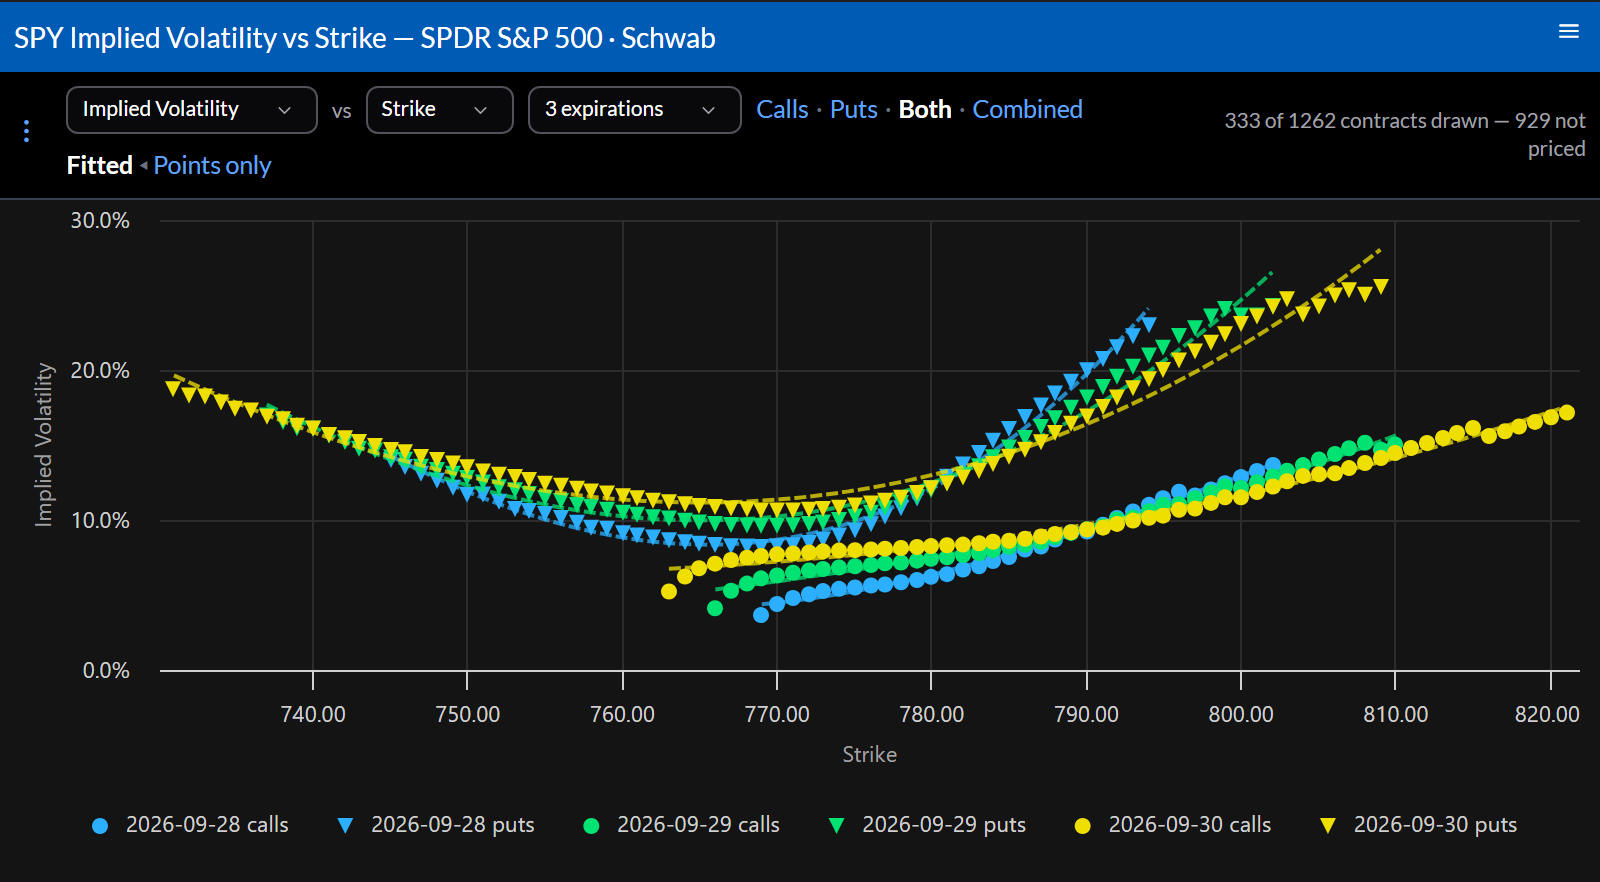
Plot listed contracts against each other, across several expirations, with an optional fitted curve: the volatility smile, delta by strike, and more. It works on the delayed feed with no account, and on real-time data from a connected brokerage. Choose the source as the Provider in the widget’s settings. See Option charting.
Settings
The top bar, saved as you change it:
- What to plot against what: Implied Volatility, Mid Price, Delta, Gamma, Theta, Vega, Rho, or Theoretical Price, against Strike, Delta, or Mid Price.
- Which Expirations.
- Calls, Puts, Both, or Combined.
- Fitted or Points only, where a fit applies.
Configure sets the Provider and Symbol.
Actions
Click a point to open that contract in an Option widget. ⋮ opens Open Quote, Open Price Chart, and Open Option Chain.