Trade Analysis
Price a multi-leg trade and see what it returns across your price forecast. It works on the delayed feed with no account, and on real-time data from a connected brokerage. Choose the source as the Provider in the widget’s settings. See Trade analysis for the page and how the figures are worked out.
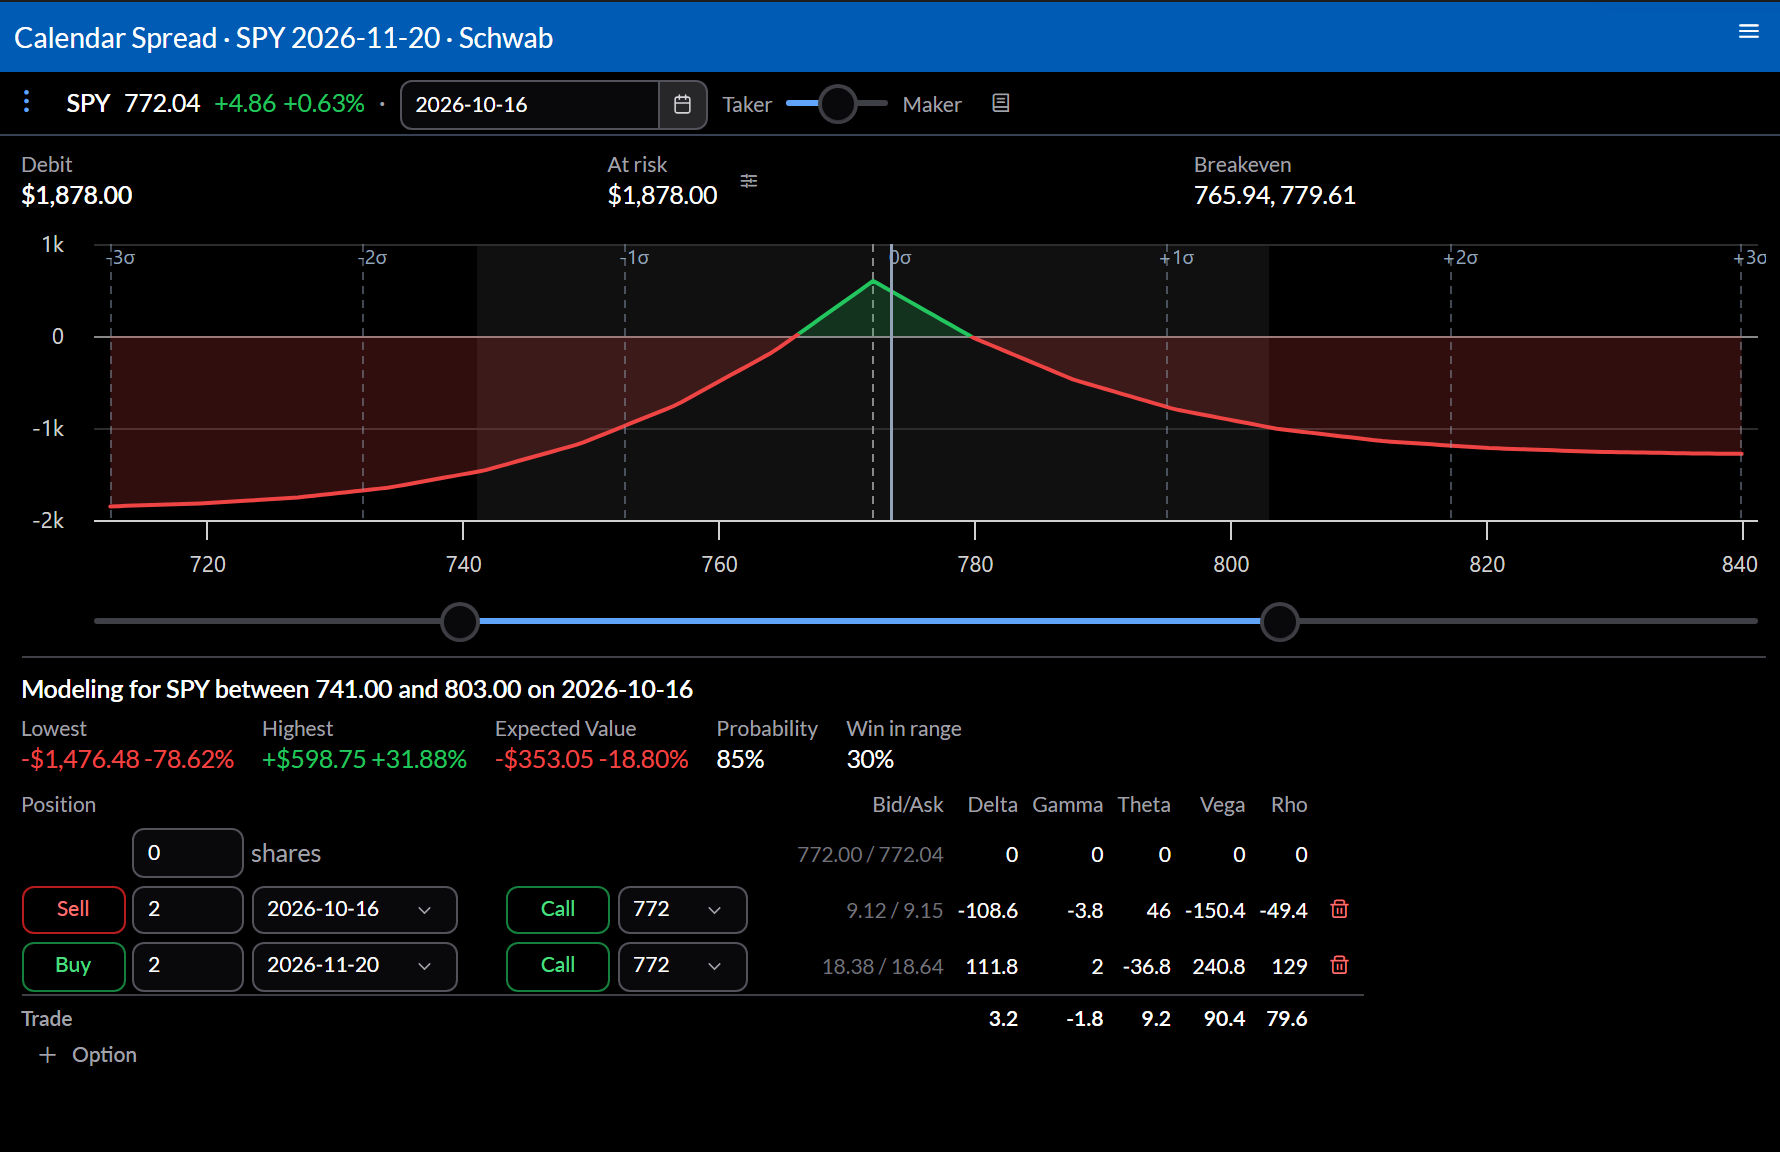
What it shows
- Debit or credit, At risk, and Breakeven prices.
- A profit and loss curve at the target date, with a slider for your low and high price forecast.
- For that range: Lowest, Highest, and Expected Value, the Probability of the range, and Win in range.
- The legs, each editable, with bid and ask and greeks, and + Option to add one.
Settings
- The top bar sets the target date the trade is evaluated at, and how fills are priced, from Taker to Maker.
- Configure sets the Provider and Underlying, and whether to Show annualized returns.
- The book icon models the trade in a Book widget with your positions.
Actions
⋮ opens the underlying in other widgets and, with a brokerage connected, Trade, which opens a Trade Ticket for the legs.