Price Chart
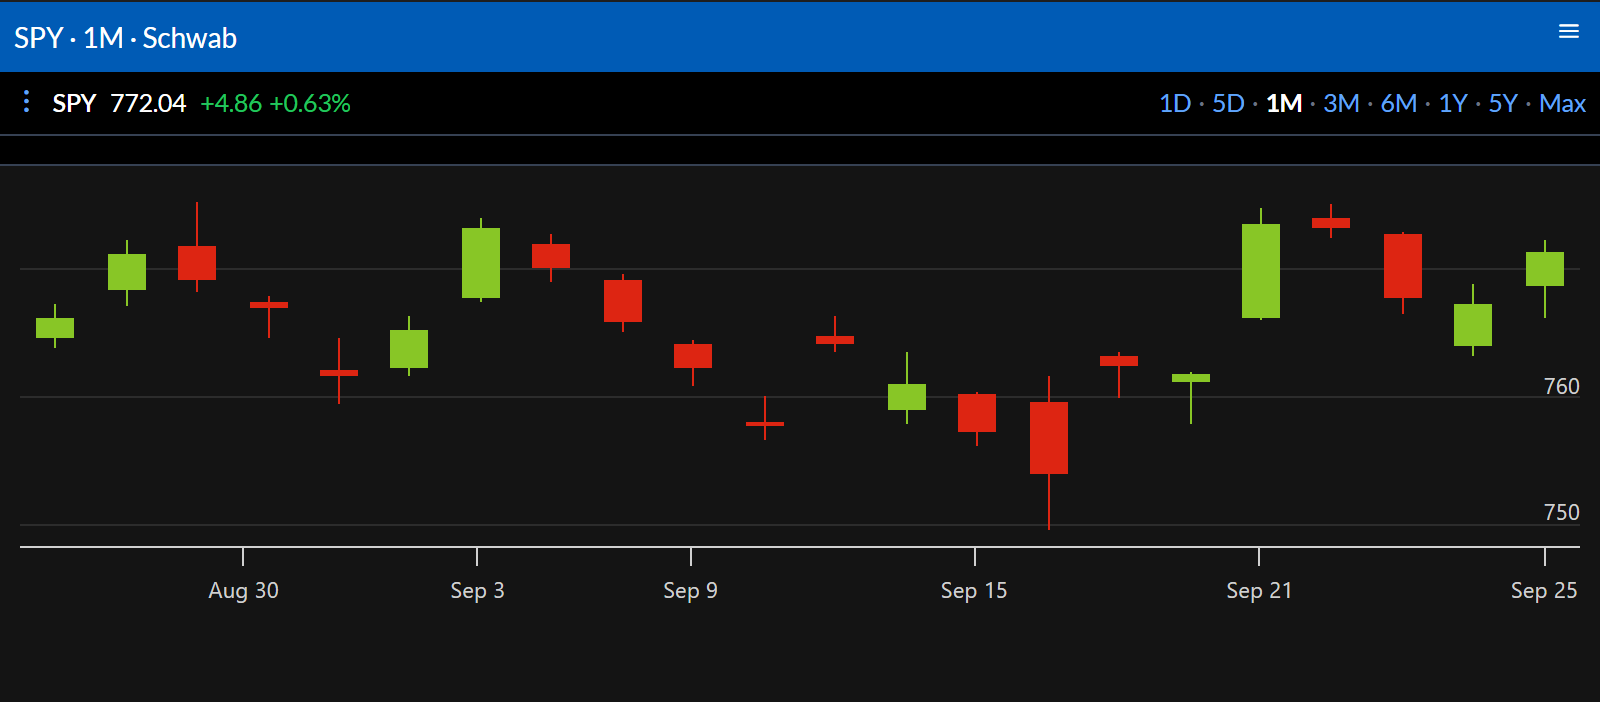
A stock’s price as candles, from today’s session to its full history. It works on the delayed feed with no account, and on real-time data from a connected brokerage. Choose the source as the Provider in the widget’s settings. It’s the chart on the stock page.
Settings
The range buttons in the top bar, 1D through Max, set the span and are saved with the widget. Sources offer different history, so some ranges may be missing. Configure sets the Provider and Symbol.
Actions
⋮ opens Open Quote, Open Option Chain, and Open Option Chart.