Price paths for multi-expiration books
A position whose contracts all expire on the same day has one value for each price on that day. A book whose contracts expire on different days doesn’t. A calendar spread that sells October and buys November passes through October on the way to any date in November, and what happens in October—the short call expires worthless, or it’s settled for cash, or it’s assigned and turns into shares—changes what’s left to value in November.
So Book management and the stress tester don’t value a book at a single price. They follow the underlying along a price path through every expiration before the target date, settling contracts as they expire, and value what’s left at the end. This page explains how those paths are built and what they assume.
One date or a path
Trade analysis values a trade at a single date and price. That’s exact when every leg is still open on that date or expires on it. A leg that expired earlier is valued as though it settled at the target date’s price, which for a calendar spread past its short leg’s expiration isn’t what would have happened. Model in book hands the trade to Book management, which follows it along a path instead.
Walking a path
A path names the underlying’s price on each key date: every expiration in the book that falls before the target date, then the target date itself. At each key date, in order:
- Dividends expected since the last key date are credited as cash on the shares held over that stretch, which may include shares that arrived through an earlier exercise. The share price on the path is lower by the same amount, so the dividend isn’t counted twice.
- Contracts expiring that day are settled at the path’s price. Out-of-the-money contracts expire worthless. In-the-money contracts follow the At expiration setting:
- Cash-settle: closed for their intrinsic value, and no shares move.
- Always exercise: every in-the-money contract is exercised or assigned, moving shares and cash at the strike.
- Exercise if covered: a short contract is assigned only where the shares you hold cover it; everything else is closed for cash.
A long and a short contract of the same kind that are both in the money on the same day offset each other and settle for cash, whatever the setting, because no shares would need to move.
- Shares acquired or delivered carry forward to the next key date.
At the target date, shares are worth the path’s final price, and contracts still open are priced as American options at the Exit volatility and Exit rate, allowing for dividends expected between the target date and their expiration. The book’s value at the target is that, plus all the cash realized on the way.
Two kinds of path
Price path chooses how the paths are drawn.
Price sweep
The default. It draws a family of paths across the range of outcomes, from three standard deviations below the forward price to three above. Each path keeps the same place in the distribution on every date: the path that finishes two standard deviations high was two standard deviations high at each expiration on the way.
That’s what makes a curve possible. Each path ends at one price, so the book’s value can be drawn against where the underlying finishes, which is the chart on the book page and the Book widget. Each path is weighted by how likely its final price is, and those weights give Chance of gain. The path in the middle, which finishes at the forward price, gives Value at target.
How far a path has traveled by each date follows the market’s own volatility to that date, read from the option chains. A week that holds an earnings report carries more of the move than a quiet week of the same length, so a path is in the right place at the expiration where a near contract settles.
What a sweep can’t show is a path that changes direction: one that rallies through the front expiration and falls back by the target. Every path in the sweep moves one way.
Monte Carlo
Random paths, each stepped from one key date to the next, so a path can rise into an expiration and fall after it. That’s exactly the case a sweep leaves out. All paths count equally, and Chance of gain is the share of them that end above the book’s value now.
Random paths don’t line up by final price, so they don’t make a curve; the chart is drawn by the price sweep. Monte Carlo paths move at one volatility, the market’s to the target date, rather than following the term structure.
Two volatilities
A book projection uses volatility for two different questions, and keeps them apart.
- How far the underlying is likely to travel by each date. This is always the market’s volatility, read at the money from the chains for the book’s expirations and interpolated between them. Where no chain gives one, the underlying’s 30-day implied volatility is used.
- How richly the contracts still open at the target are priced. This is Exit volatility:
- Current market prices each contract at its own implied volatility, so skew and term structure are kept. A contract with no implied volatility of its own uses the at-the-money level.
- Custom scales every contract’s implied volatility by the ratio of your figure to the current at-the-money level, so the smile keeps its shape. The label’s tooltip shows the ratio.
Raising exit volatility makes the options you still hold worth more at the target. It doesn’t make a large move in the stock any more likely.
Exit rate is the interest rate contracts are priced at on the target date: Current market reads the risk-free rate curve at the target’s horizon, or you can set your own.
Reading the chart
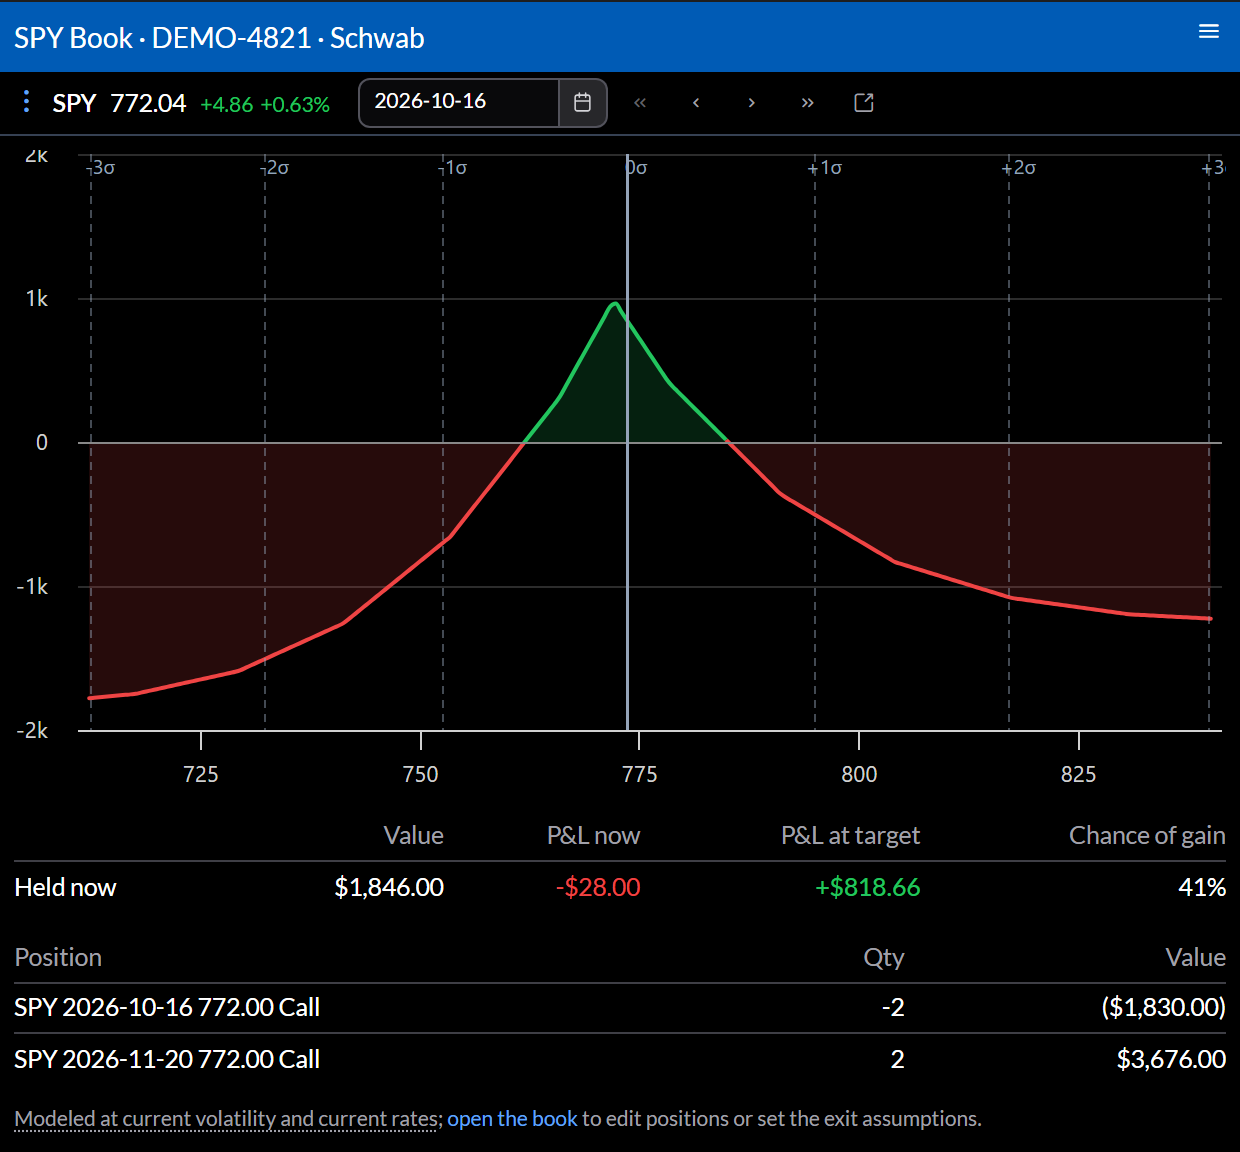
This SPY calendar spread is short a call in the front month and long the same strike a month later. Valued at the front month’s expiration, the short call settles at the target itself, and the curve is the familiar tent around the strike:
One week later, the short call has already settled on the way, at the price each path had reached by the front expiration. What’s left is the long call:
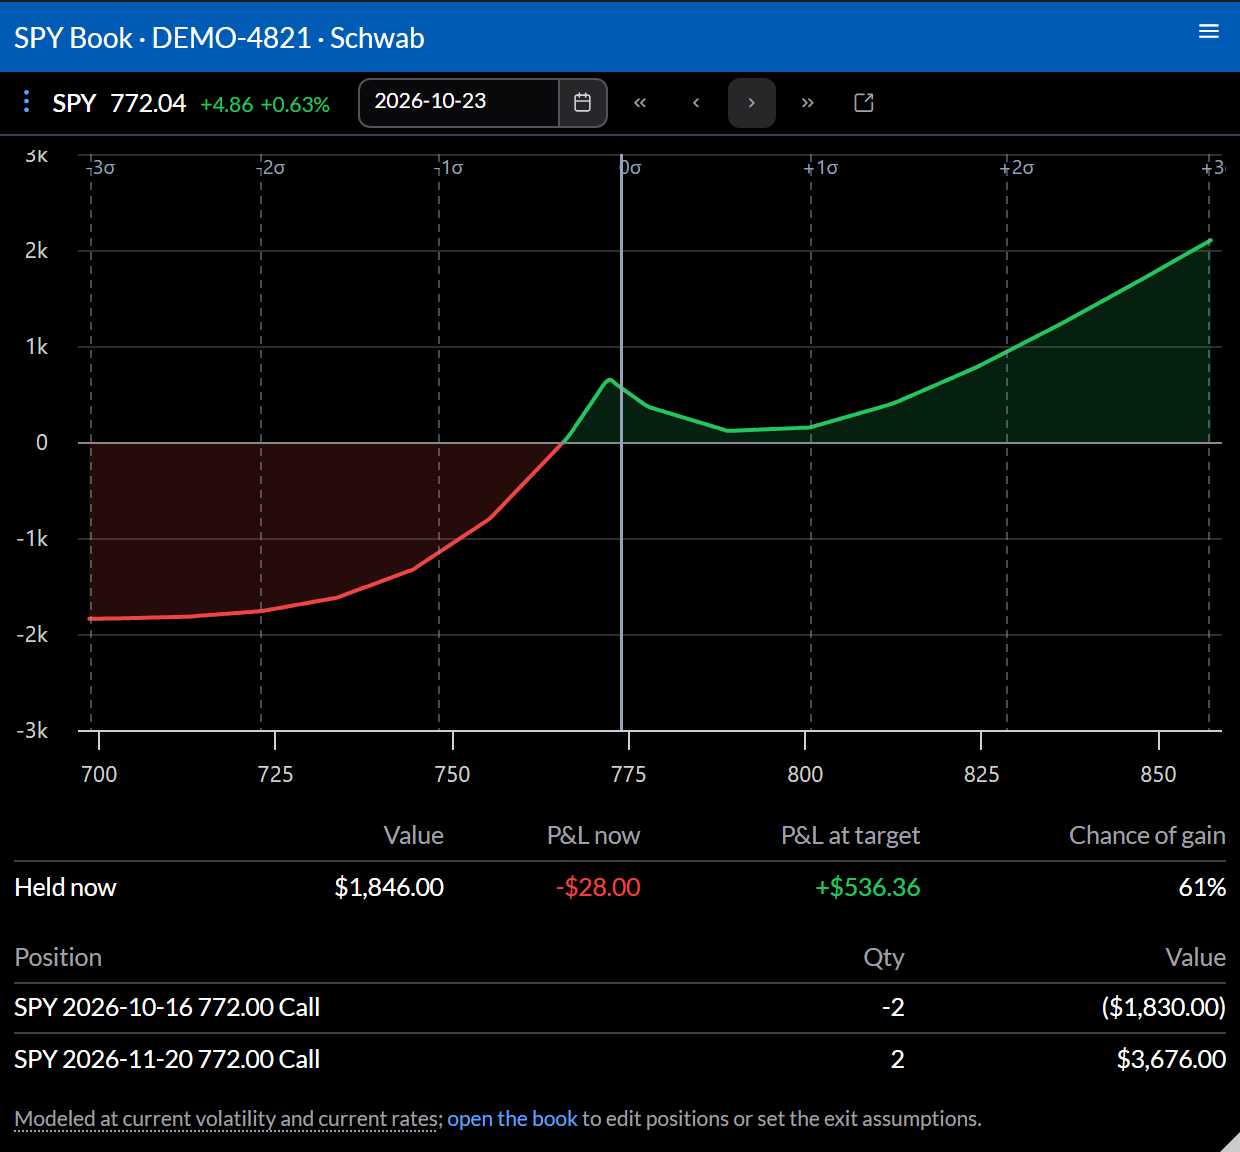
Look at the right-hand side. A path that finishes high was already high at the front expiration, so the short call was settled there, for less than the long call gained as the price kept rising. On the left, both calls are worth little and the book loses about what it paid. The positions table still lists both contracts, because it shows what you hold today.
The stress tester’s paths
The stress tester runs the same walk, with one path per underlying: the one that ends at the price you assign. Before the target, the path covers the distance in proportion to the variance the market expects by each date, so a move is mostly made by the end of a week that holds an earnings report. The distance is measured in ratios rather than dollars: halfway from 100 to 50 is about 71, not 75.
At account scope the stress tester leaves dividends out and holds cash flat; a book’s own page models dividends.
Assumptions and limits
- Lognormal, one volatility per date. Each date’s distribution is lognormal at the market’s at-the-money volatility. Real markets fall sharply more often than that, so the chance of a large drop is understated.
- Drift at the risk-free rate. Paths center on the forward price, not on any forecast of returns.
- Sweep paths move one way. Reversals are only in Monte Carlo.
- Contracts settle at expiration. Early exercise or assignment before a contract’s expiration isn’t modeled on the way to the target. Contracts still open at the target are priced as American options, which includes the value of exercising early from then on.
- Dividends are projected from the declared ex-dividend date and the company’s usual cadence, evenly spaced. When the cadence is unknown or irregular, future dividends aren’t projected.
- Positions that can’t be valued are left out of the total, and the total says how many are missing.
These are models of how the price might move, not forecasts of how it will, and nothing here is investment advice. See Disclosures & Model Limits.