Option charting
The Charts tab plots a symbol’s contracts against each other, one series per expiration, so you can compare expirations at a glance: implied volatility by strike, for example.
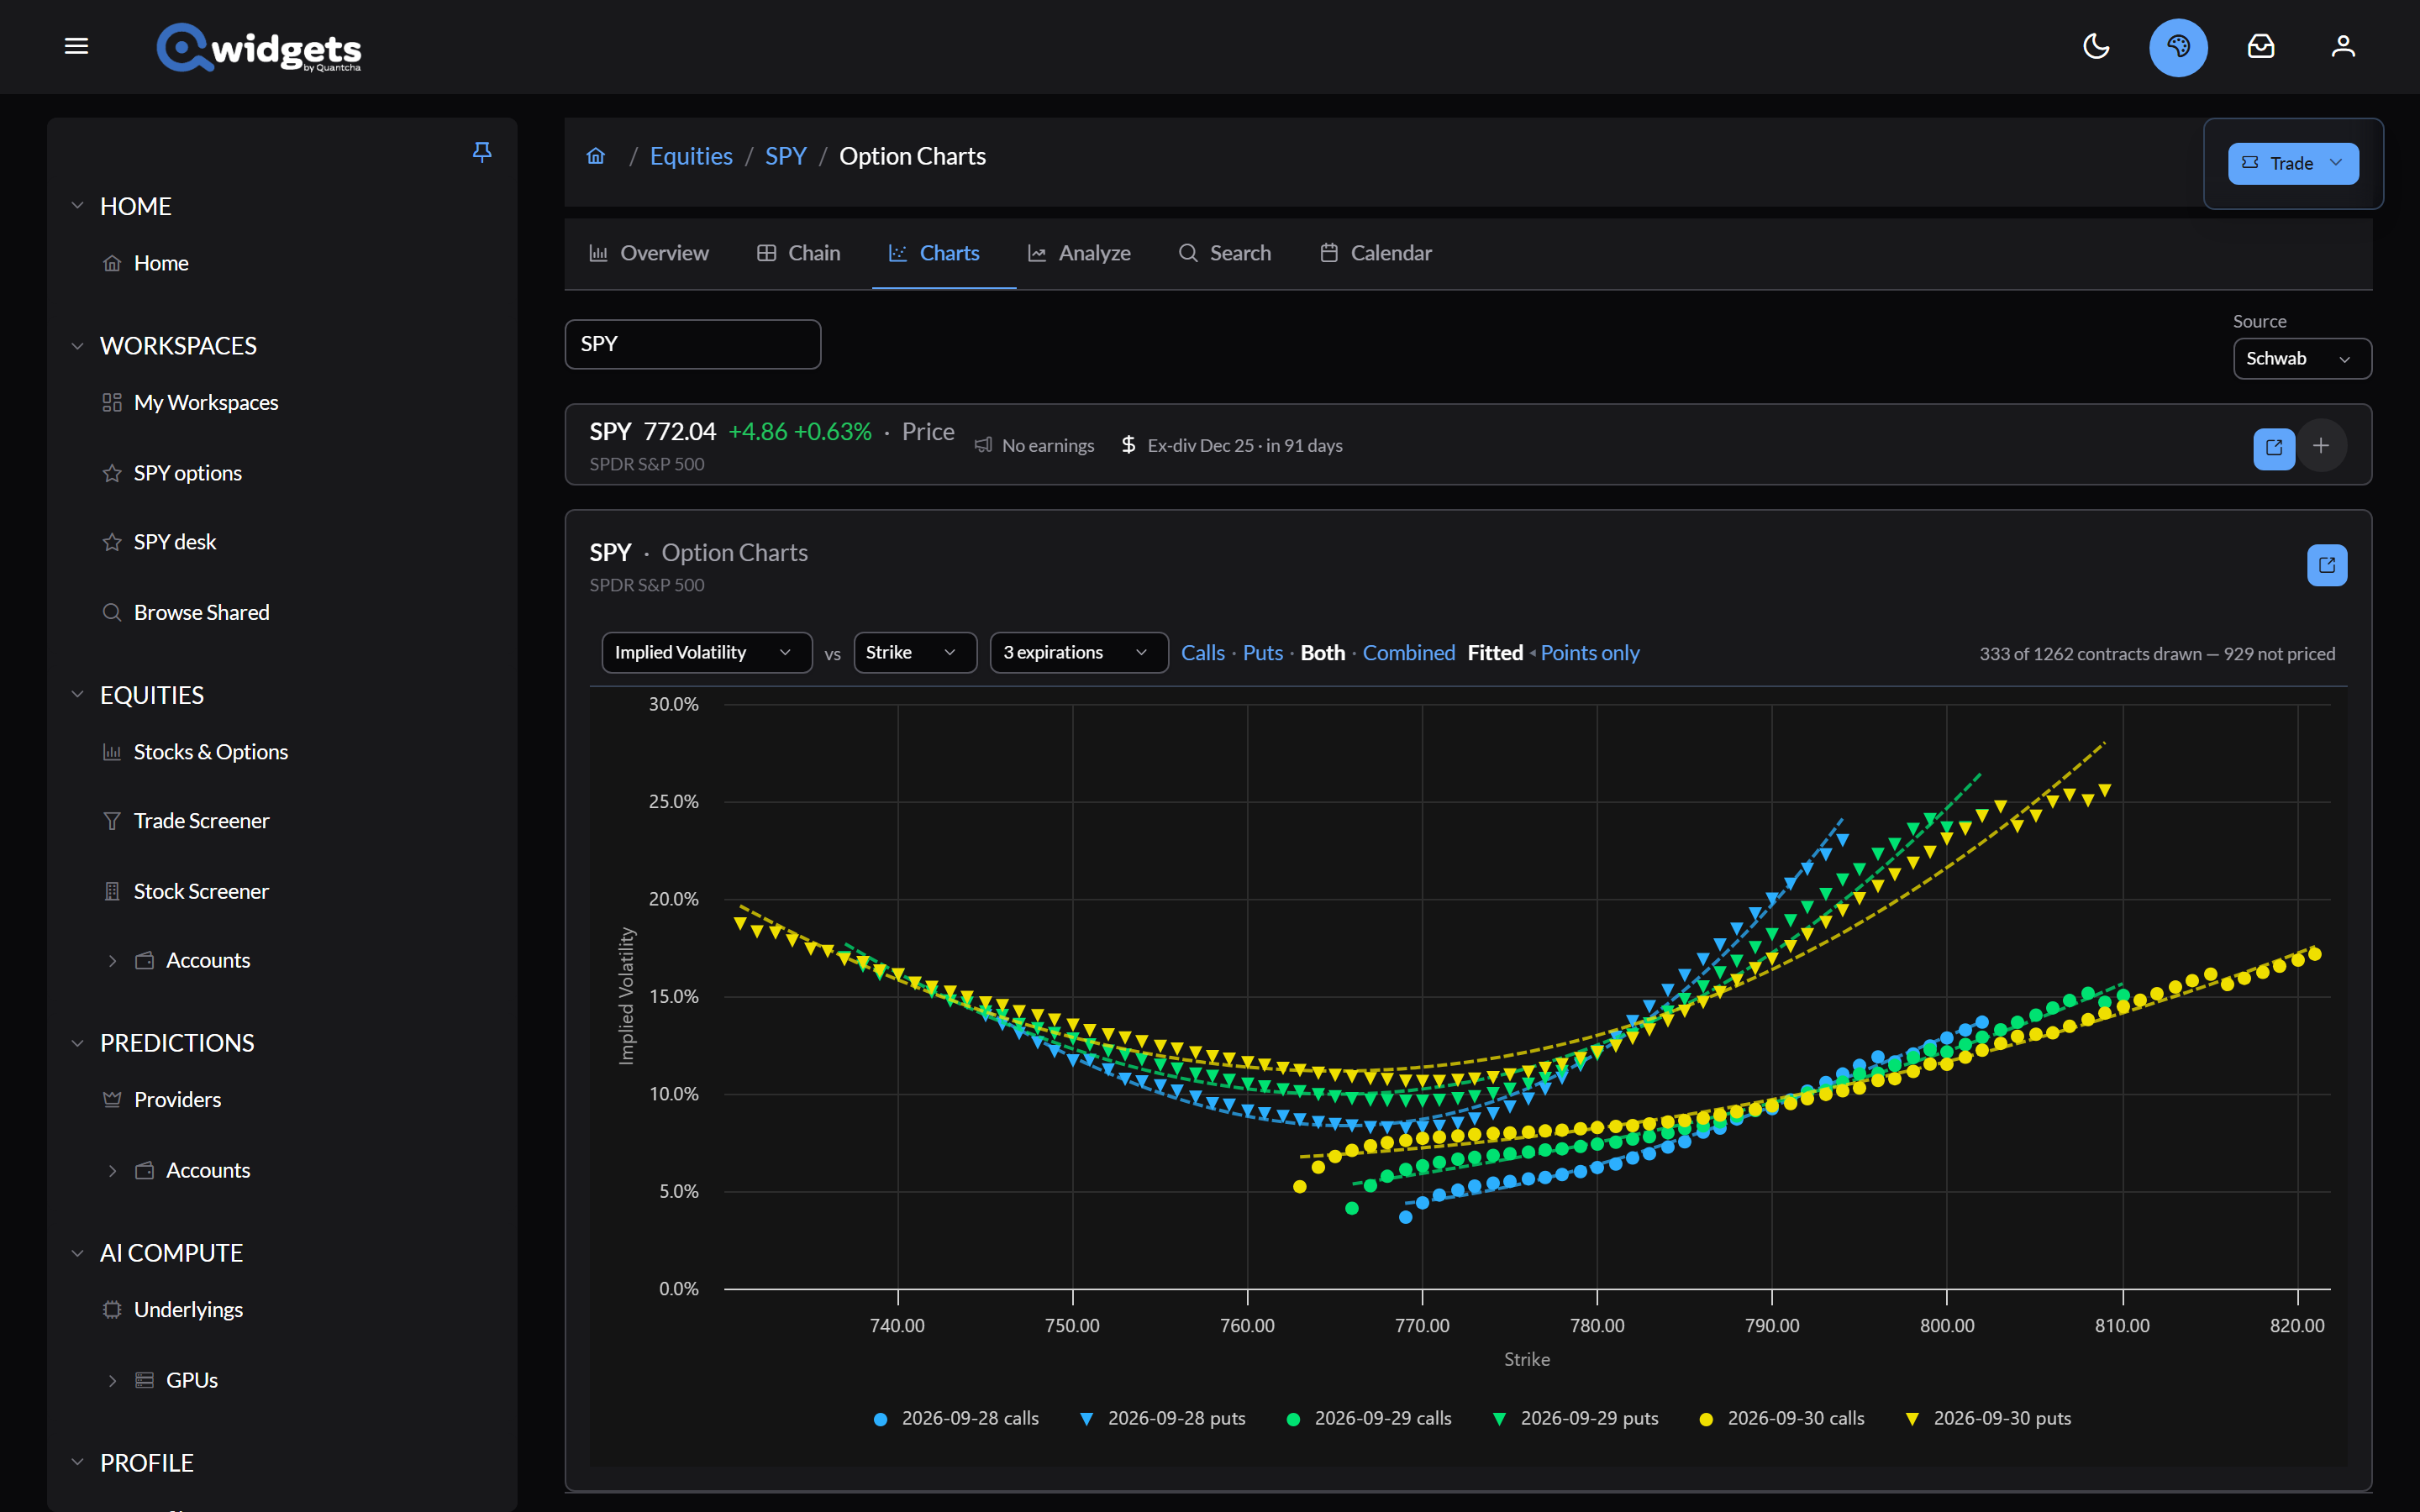
Controls
- Measures: pick what goes on each axis, in the form Y vs X.
- Across (X): Strike, Delta (absolute), or Mid Price.
- Up (Y): Implied Volatility, Delta (absolute), Gamma, Theta (absolute), Vega, Rho, Theoretical Price, or Mid Price.
- Expirations: choose which expirations to plot.
- Calls, Puts, Both, or Combined.
- Fitted draws a curve through each expiration’s points; Points only shows just the contracts.
The line at the right says how many contracts are drawn, and how many couldn’t be priced. The page’s address keeps your choices, so a chart can be bookmarked or shared.