Prediction Event History
How the odds of an event’s markets have moved, one line per market.
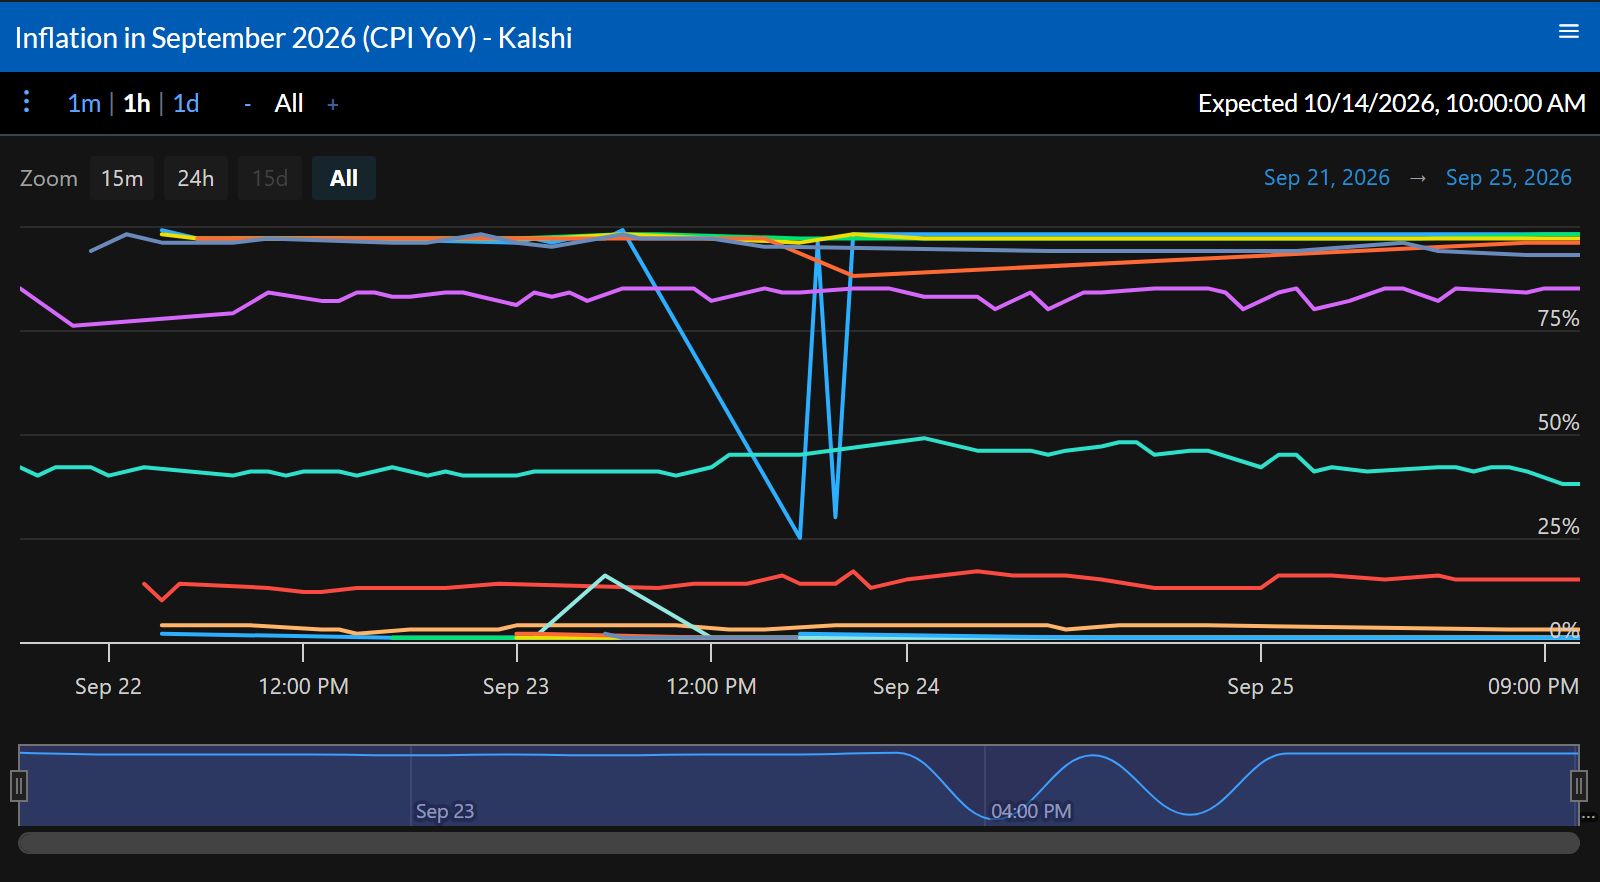
What it shows
A line for each of the event’s top markets by current value, over time, with a navigator for zooming in on a stretch. Clicking a point opens a menu for that market.
Settings
- 1m, 1h, or 1d in the top bar sets the interval between points.
- − and + set how many markets are drawn, up to All.
- Configure sets the Provider, Event ID, and Market Count.
Actions
⋮ opens Open Event Chart, Open Event Table, and Open Related Events, and the Distribution Builder when you can trade the event.