Trade analysis
The Analyze tab models any trade on one underlying: shares, option legs, or both. Every search and screen in Qwidgets opens its results here.
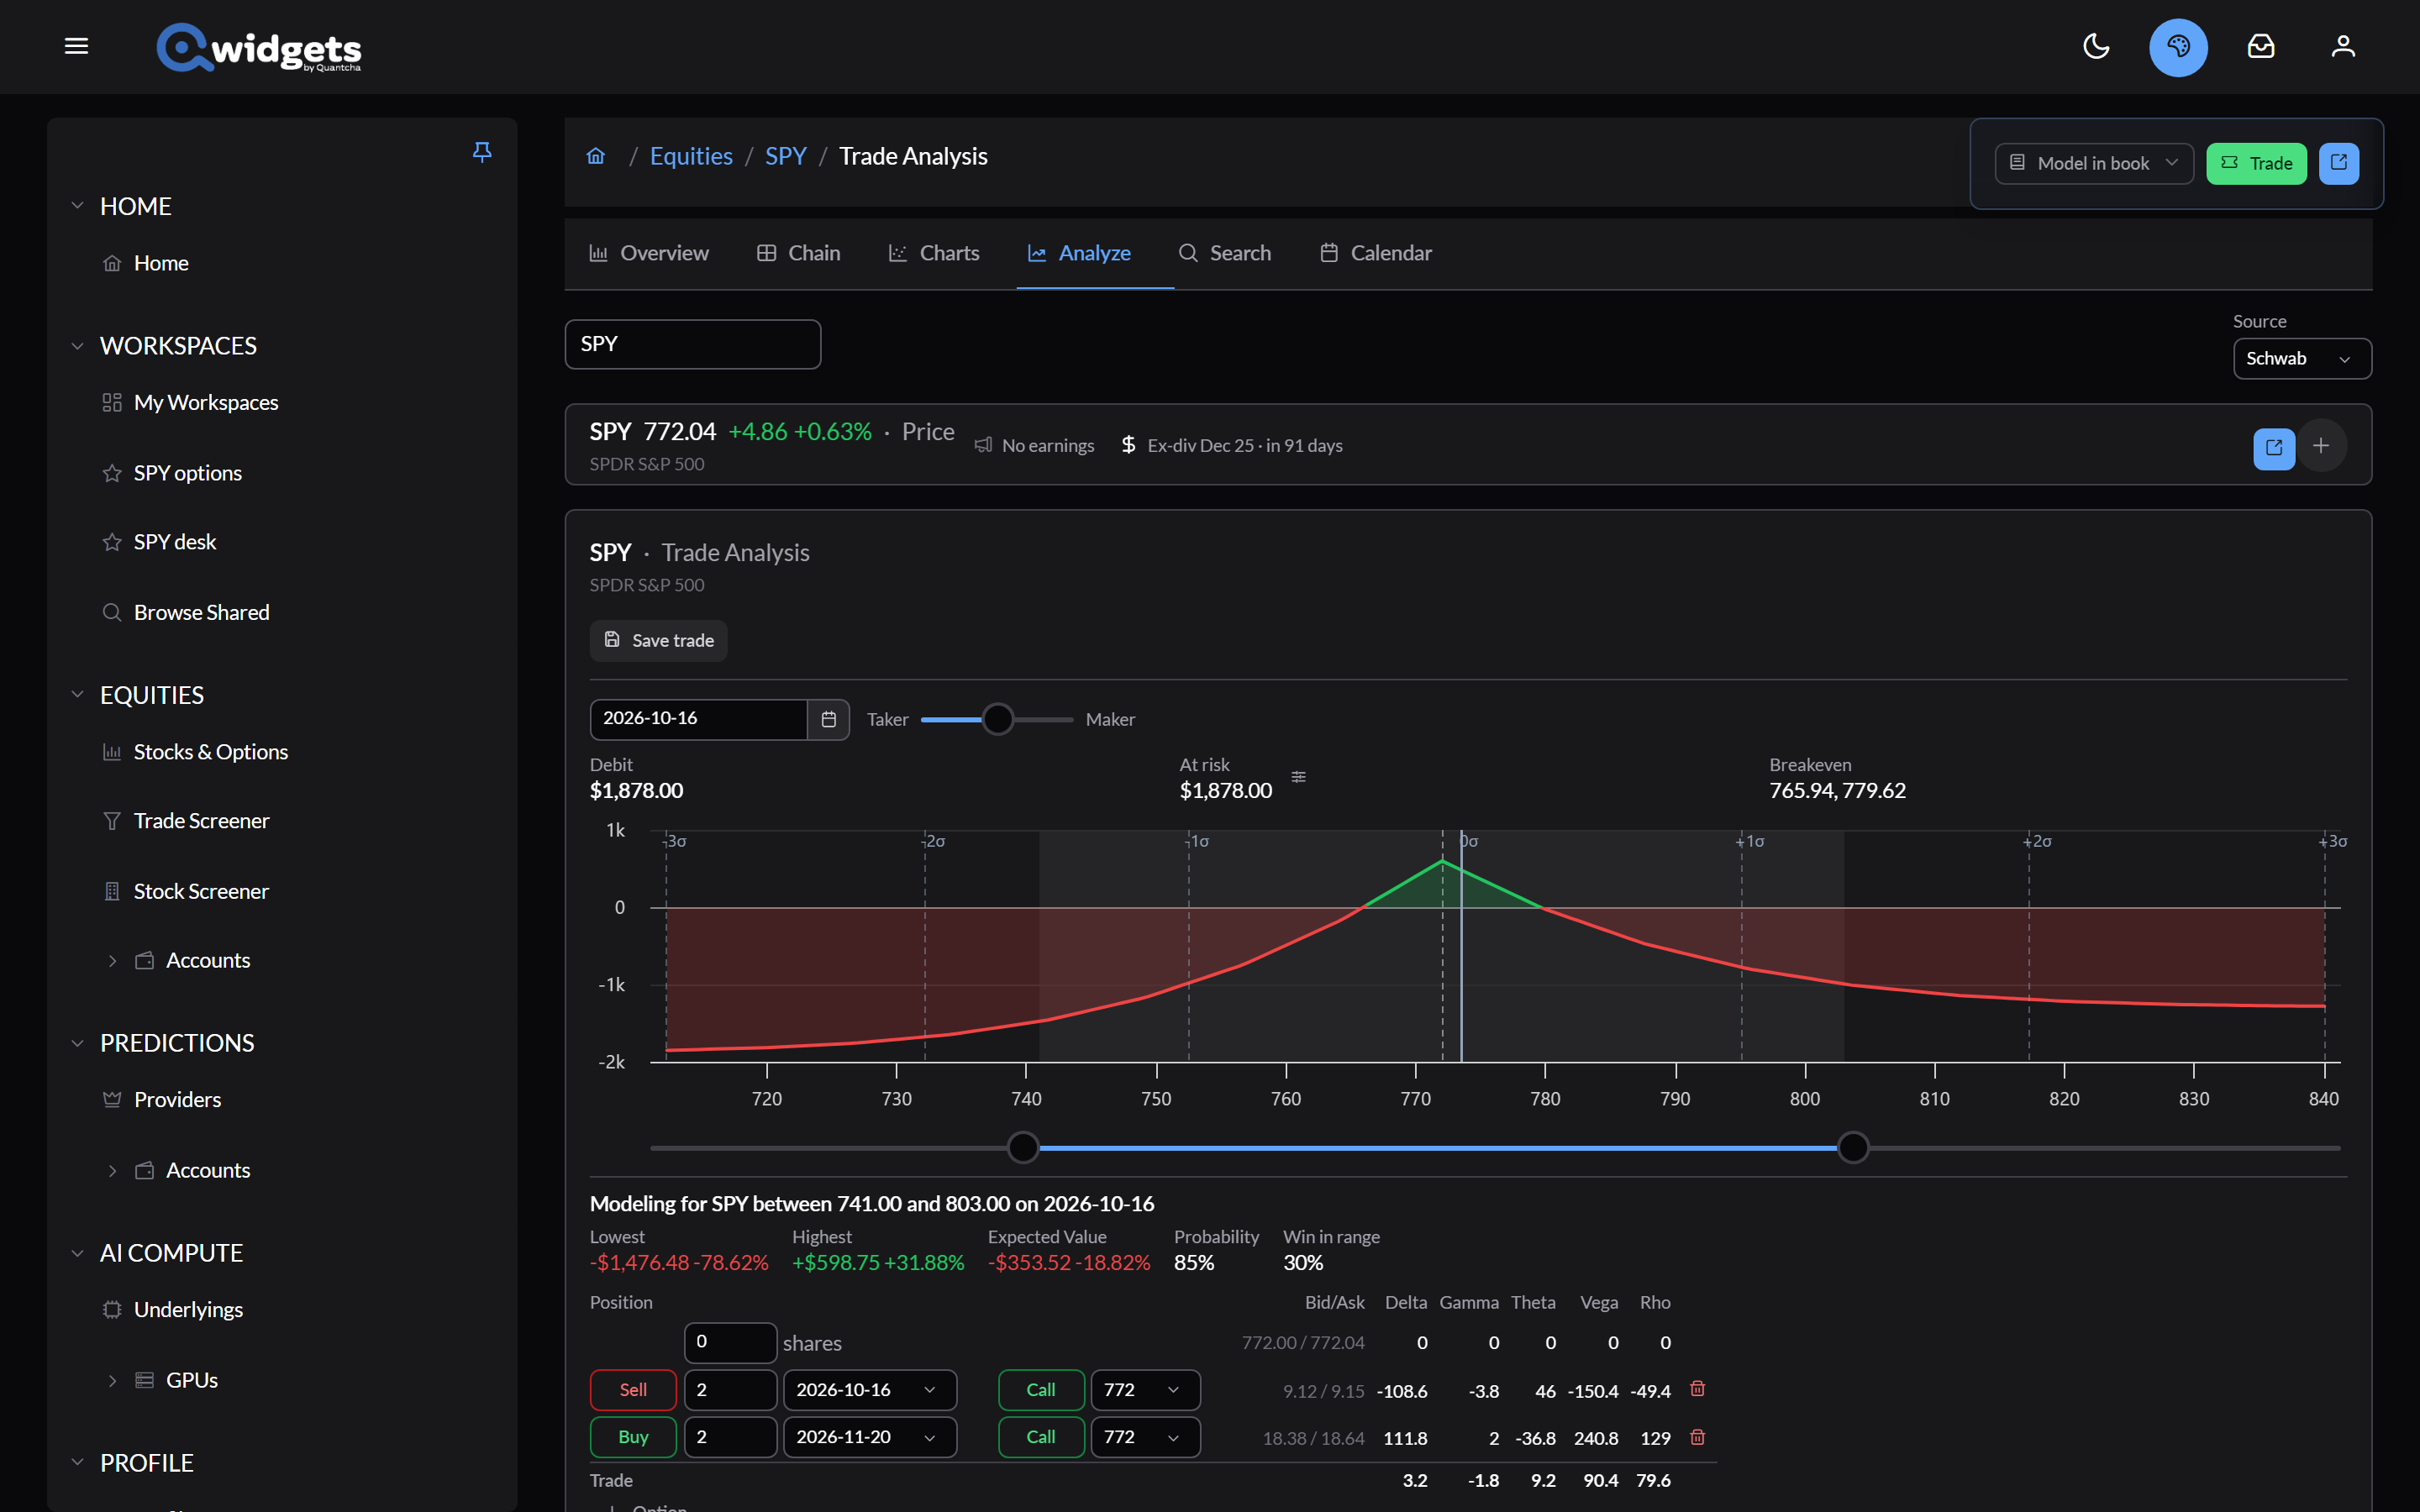
Build the trade
The legs table at the bottom holds the trade:
- The shares row: Buy or Sell and a quantity.
- Each option row: Buy or Sell, a quantity, an expiration, Call or Put, and a strike. Its bid/ask and Greeks show alongside, and the Trade row totals the Greeks.
- + Option adds a leg; the trash can removes one.
Set the assumptions
- Date: the date the trade is valued at. Dates a leg expires are bold.
- Fill assumption: where between the bid and the ask you expect to trade, from Taker to Maker. The midpoint is the default.
- Forecast: drag the range under the chart, or across the chart itself, to say where you think the underlying will be.
- Size to a budget (the icon next to At risk): enter Most I want at risk and the trade is scaled to fit.
Read the results
- Debit or Credit, At risk, and Breakeven summarize the trade.
- The chart shows profit and loss across prices at the date, green above zero and red below, with standard-deviation marks and your forecast range shaded.
- Under Modeling for…, for the forecast range:
- Lowest and Highest: the worst and best outcome inside the range.
- Expected Value: profit or loss, weighted by probability.
- Probability: the chance the underlying lands in the range.
- Win in range: the chance the trade is profitable, given it lands in the range.
These come from a model with stated assumptions; see Disclosures & Model Limits.
Take it further
- Trade opens an order ticket in your brokerage account with these legs.
- Model in book adds the trade to an account’s book as pending changes and opens Book management.
- Save trade keeps the trade in your saved trades, when you’re signed in.
- The page’s address updates as you edit, so you can bookmark or share a trade.