Screen for cash-secured puts
Picking a strike on one stock is a matter of reading its chain. Finding which stocks and funds to run a Wheel on is a search across the whole market. In this tutorial you’ll set up the Trade Screener to find cash-secured puts in the expiration and delta range you choose, leave out any with earnings before expiration, and open one in Trade analysis.
You don’t need an account; the screener always runs on the delayed feed. The screenshots follow one screen from start to finish.
1. Open the Trade Screener
Select Trade Screener in the left-hand menu.
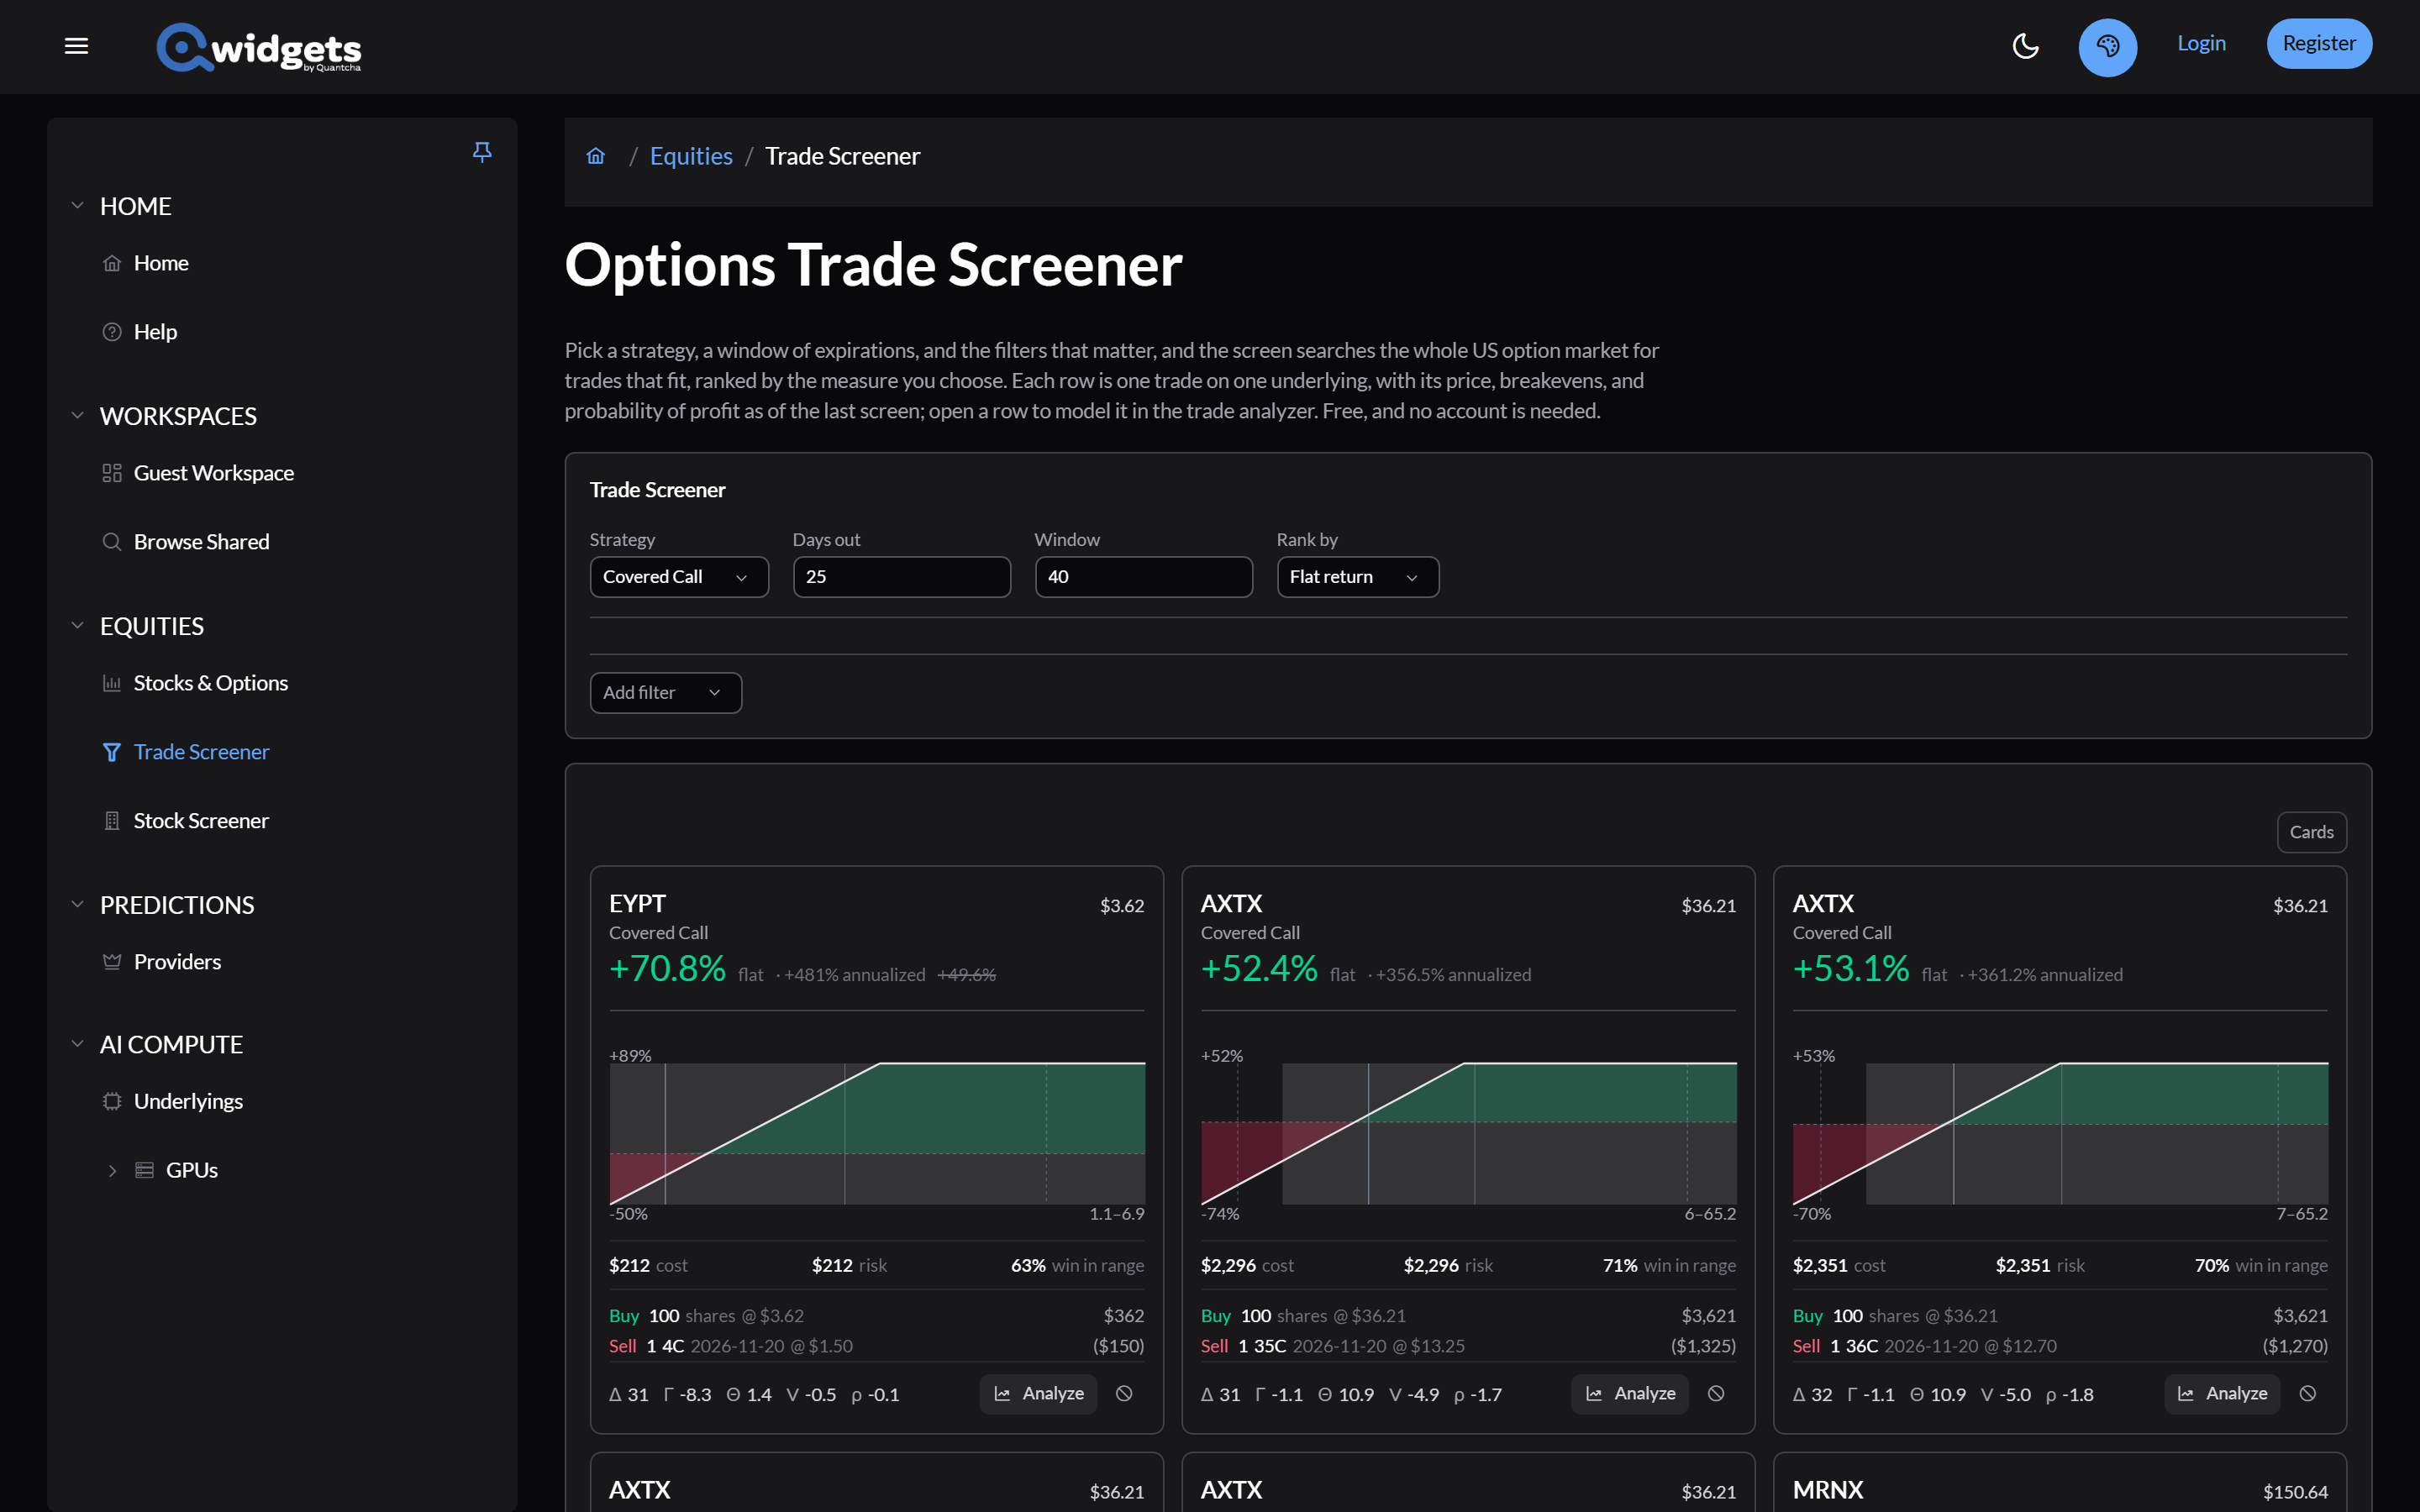
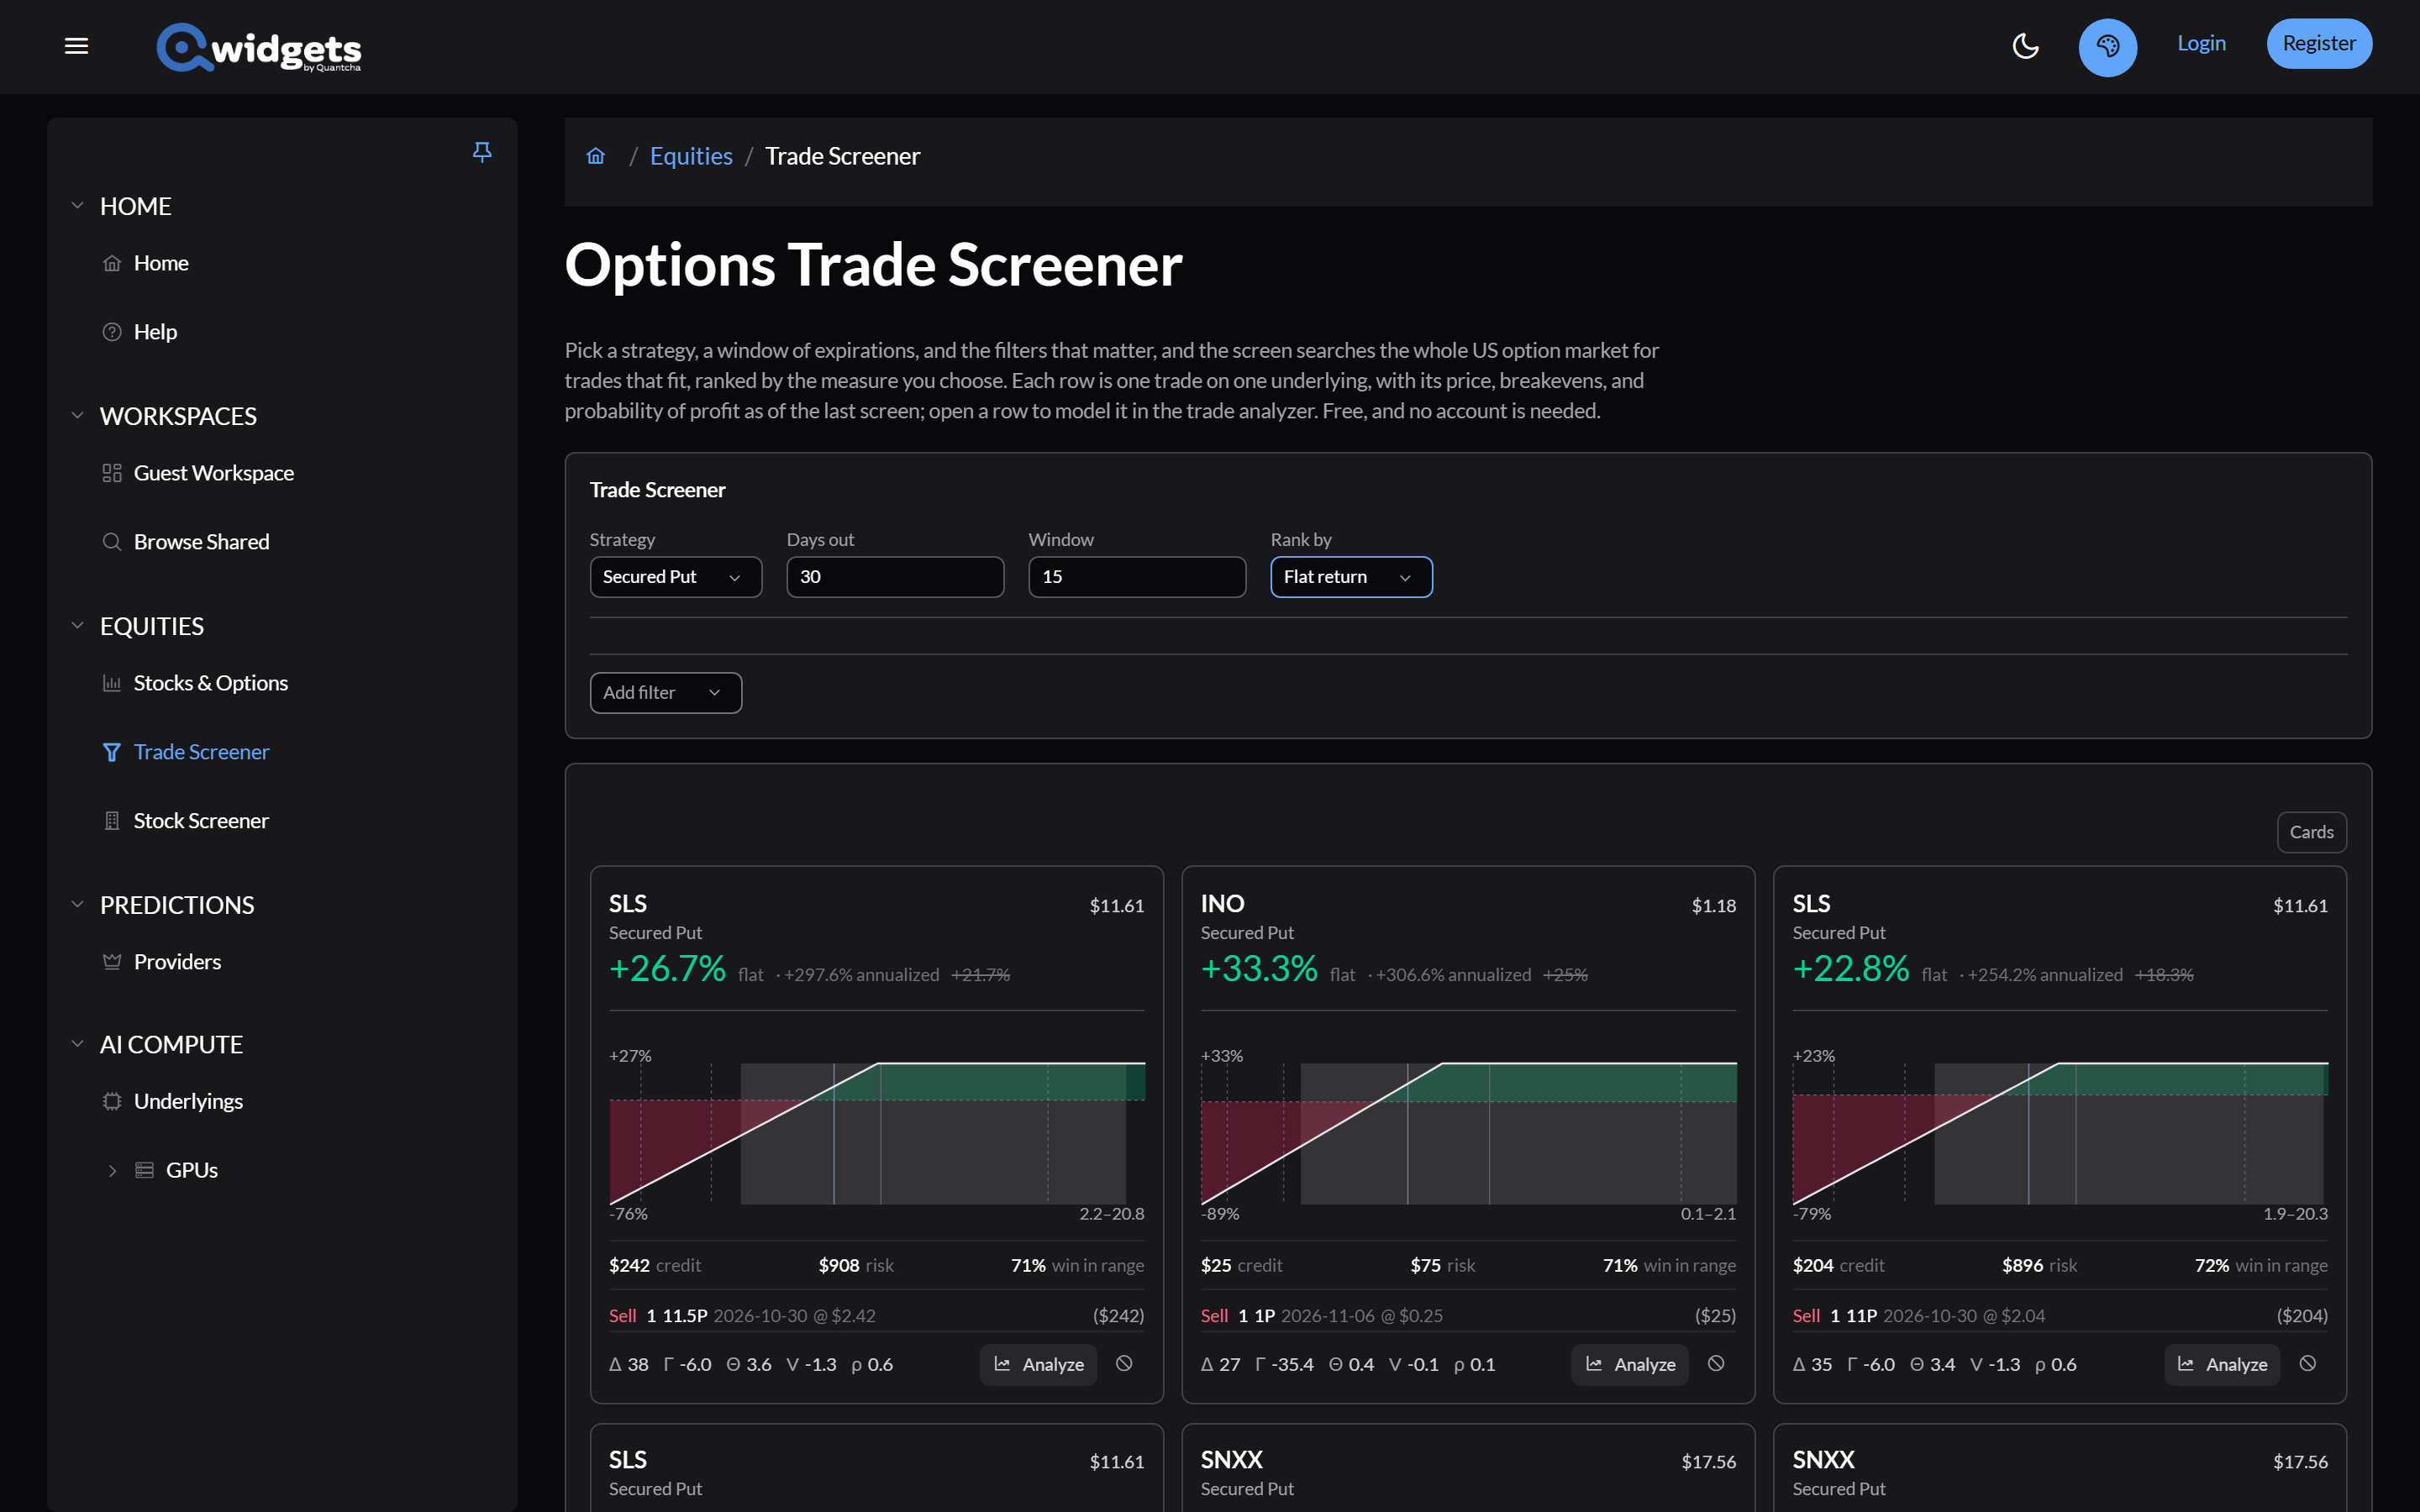
2. Choose the strategy and expirations
- Set Strategy to Secured Put.
- Set Days out to 30 and Window to 15, to search expirations 30 to 45 days from today.
3. Filter to the puts you’d sell
Open Add filter and add three. For each range filter, set its values and select the check mark to apply it.
- Delta, absolute, in the Greeks group: set it to Between 0.25 and 0.35, to keep puts near the strike you’d choose. It’s the size of the delta, so you don’t need to think about the sign.
- Open interest, in the Liquidity group: it starts at 500 or more, so the contracts already have holders. Apply it as it is.
- Earnings before expiration, in the Events group: it’s added set to No report, which leaves out puts that span an earnings report.
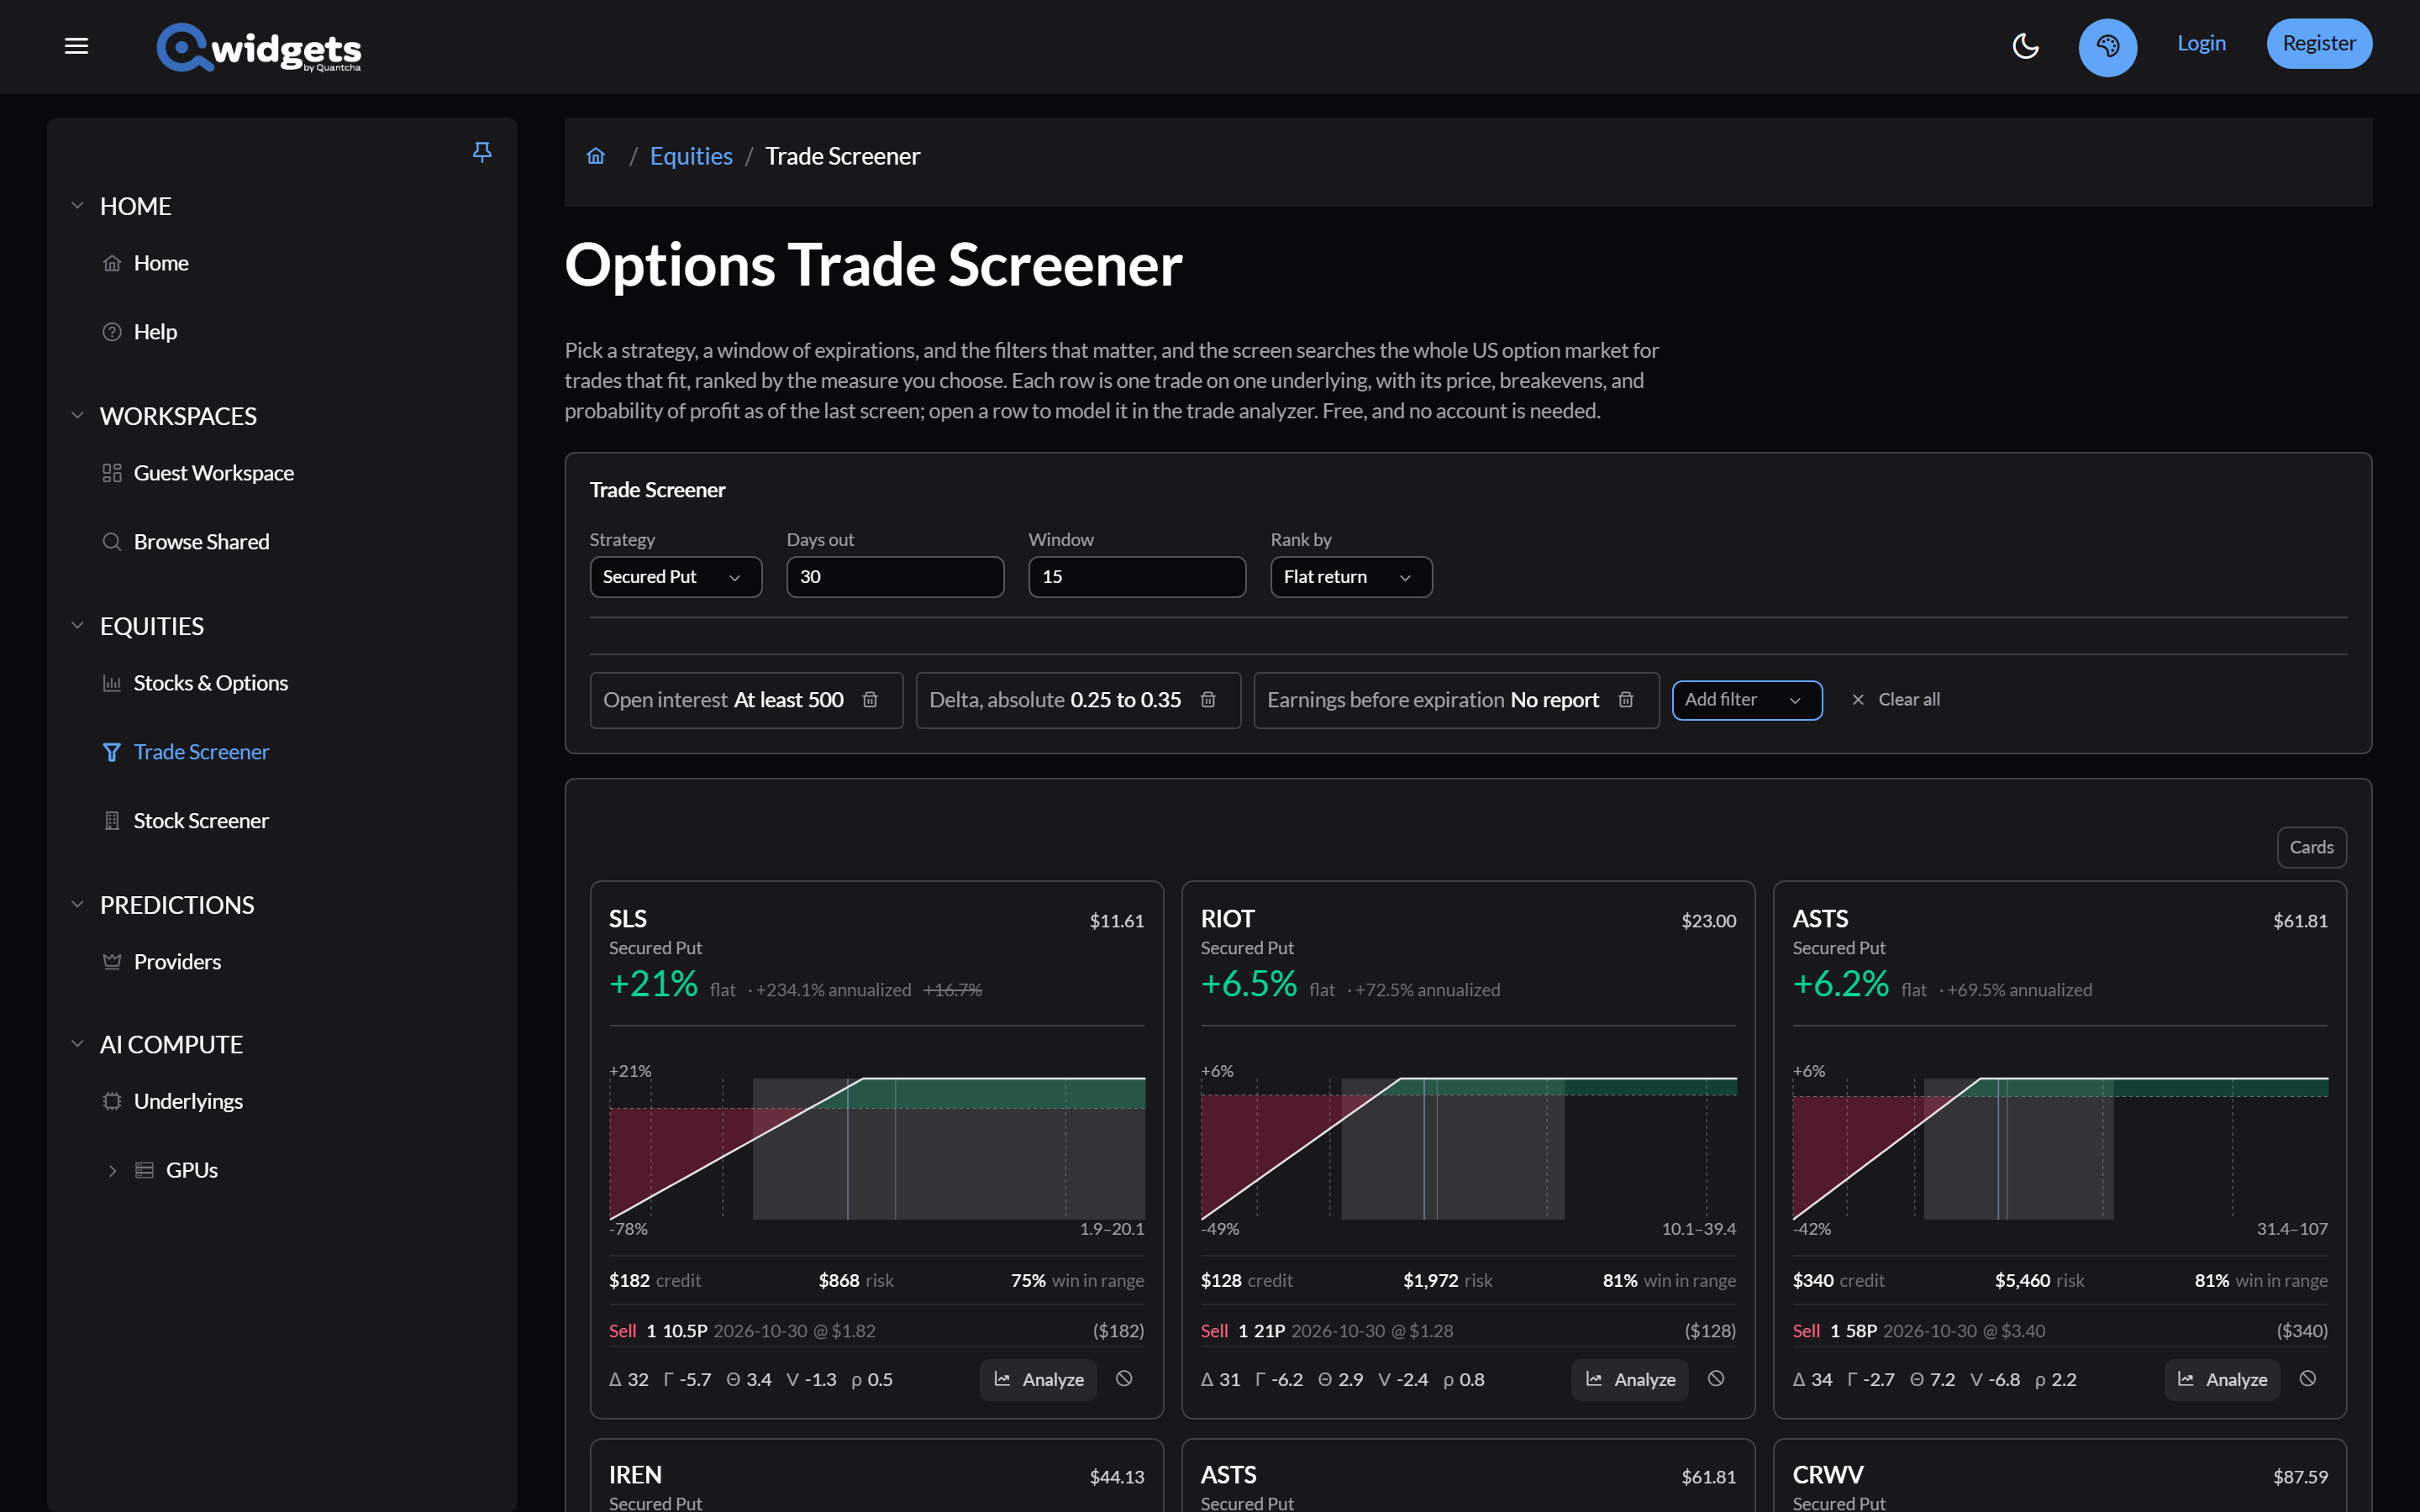
The earnings filter matters more than it looks. A put that spans an earnings report pays more because it carries the report’s risk; Check the calendar before you sell explains why. Either setting also leaves out underlyings with no scheduled report, which includes most funds, so remove it when you’re screening funds.
4. Rank and read the results
Set Rank by to Average annualized. The results show as cards.
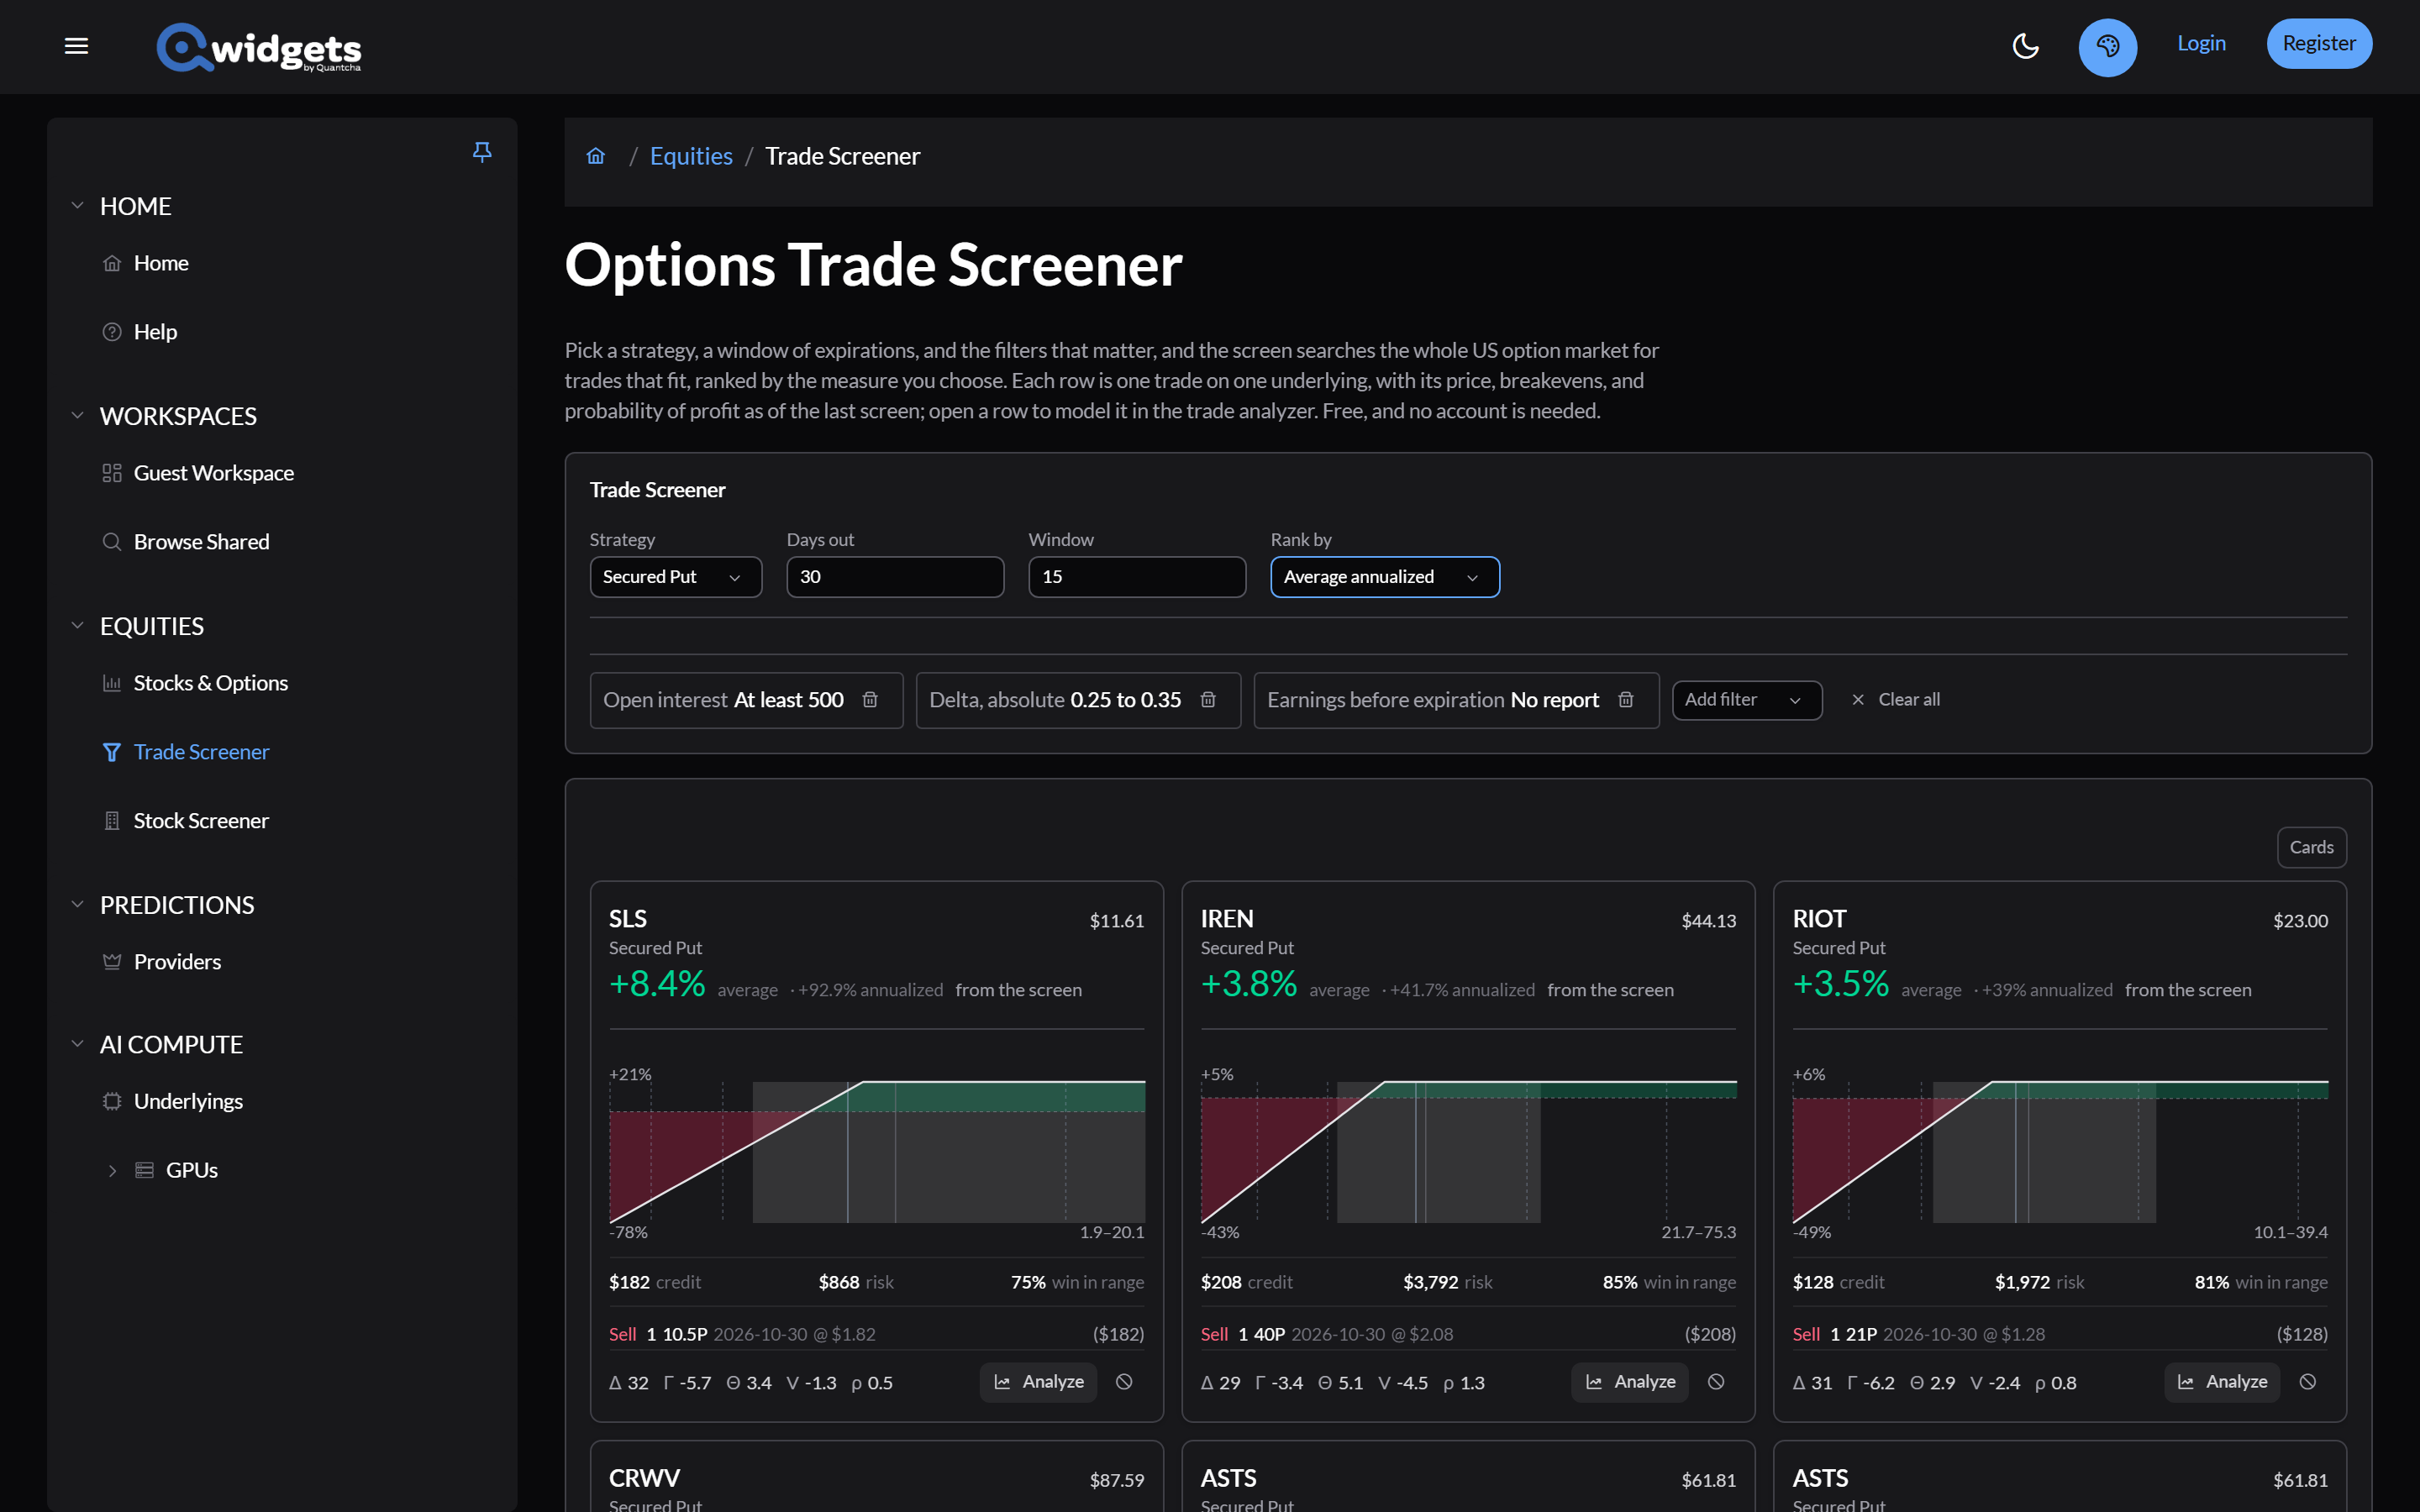
Look at the top results’ underlyings. The highest returns usually belong to the most volatile names, because implied volatility is what the premium pays for. A high return at the top of this list is the market charging for a larger risk, not a better deal. Compare each card’s return with its win in range and ask whether you’d be comfortable owning that underlying at the strike.
5. Open a result in Trade analysis
Select Analyze on a card. The trade opens in Trade analysis on delayed prices, with the screen’s date and forecast range.
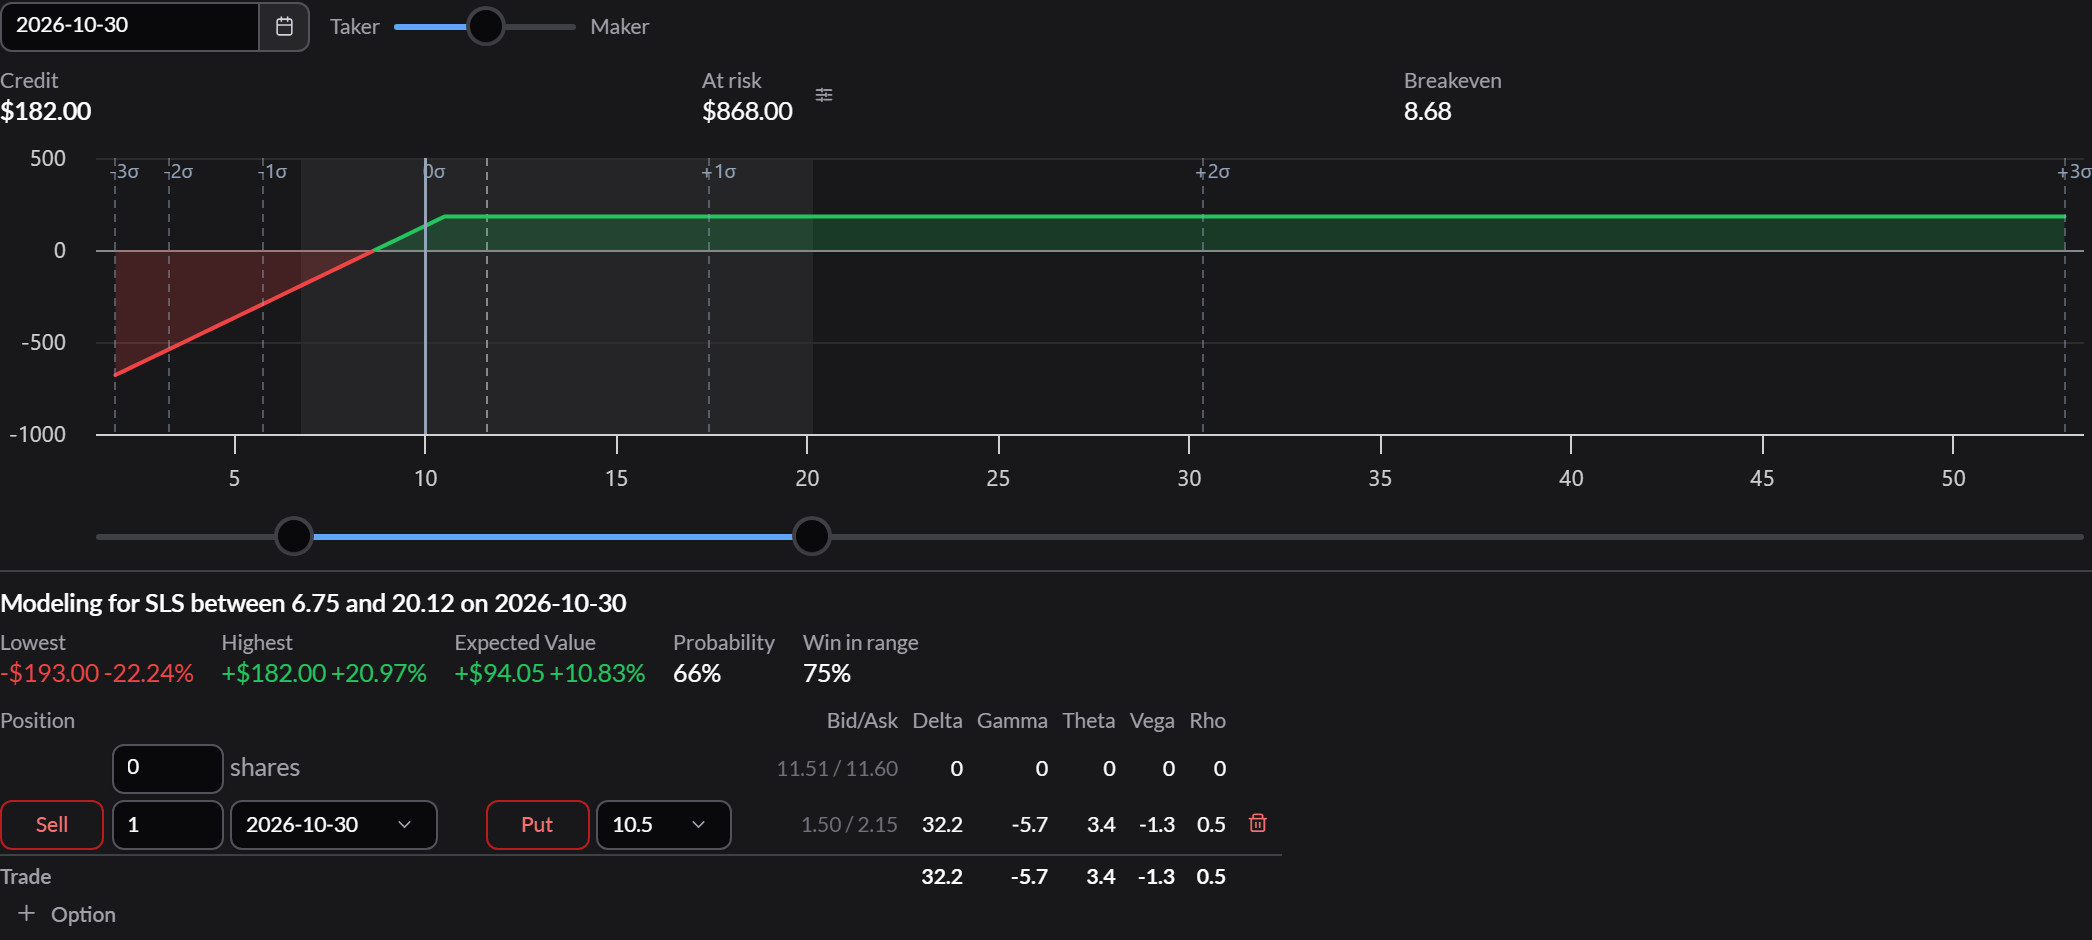
From here, Analyze a cash-secured put walks through reading it.
What’s next
- Trade screener: every strategy, ranking, and filter.
- Choosing strikes and expirations: what the delta range is choosing between.
- The Wheel: the learning path this tutorial belongs to.